
An Analysis Of Recent CDER Observation & Warning Letter Data
By Barbara Unger, Unger Consulting Inc.

Each spring, the FDA publishes data on its website related to Form 483 inspection observations and warning letters issued by the Center for Drug Evaluation and Research (CDER) during the previous fiscal year. By analyzing this annual data — and comparing it to that of other recent fiscal years — pharmaceutical and biopharmaceutical manufacturers can gain a clearer picture of FDA enforcement trends and their potential impact on business and the industry as a whole.
In this article, we will compare results from the FDA’s 2015 fiscal year with results from fiscal years 2013 and 2014. We will start with the inspection observations and determine which were the most common citations, providing potential reasons for obvious changes in 2015 over previous years. It is important to note that the data published on the FDA website represents only Form 483s that were reported via the FDA’s Turbo EIR automated reporting system — manually prepared 483s are not published online and thus are not part of my analysis.
After reviewing the inspection observations, we will move on to CDER GMP warning letters from the same time period and look at product category, geography, and trends in deficiencies that are cited. Appendices 1 through 3 provide listing and links to the warning letters for each of the fiscal years.
High-Level Analysis
The annual number of CDER inspection observations did not change significantly between FY 2013 and FY2015, even though there are some slight increases in the frequency of certain observations. These changes may represent an increased focus on compounding pharmacies and outsourcing facilities, though data is not available to confirm this theory. Remember that this data does not include all 483 observations, only those prepared within the Turbo EIR system.
Drug GMP warning letters issued to compounding pharmacies increased dramatically from FY2013 to FY2014 and 2015. This represents an unusual enforcement focus on a single segment of the drug industry. FDA’s legal authority over these entities was clarified in the Compounding Quality Act, part of the Drug Quality and Safety Act signed into law in November 2013, and explains the apparent explosion of enforcement action. FDA Office of Regulatory Affairs (ORA) statistics show that approximately 3% of inspections result in warning letters, but for compounding pharmacies and outsourcing facilities the value is close to 40%, according to Lachman Consultants.
The number of warning letters issued to non-compounding pharmacy sites in the U.S. decreased dramatically during the same period. The number of warning letters issued to sites outside the U.S. (OUS) has also decreased since FY2013. Enforcement focus seems to be sharply focused on compounding pharmacies at the possible expense of both U.S. and OUS pharma sites. (See Tables 2 and 3, Figures 3, 4, and 5)
Between FY 2013 and 2015, many of the warning letters issued regarding sites located outside the U.S. identified deficiencies in data integrity / data management. I will explore this trend — along with a review of recent data integrity-related guidances from FDA and the World Health Organization (WHO) — in my next article.
Inspection Observations
The following data is based on inspections generated using the FDA Turbo-EIR system. Data from inspections of API manufacturers and form 483s generated outside the system are not included. Data in the Table 1 is collated based on data from the FDA website with one difference. Some citations, such as 21 CFR 211.192, are actually divided into several line items throughout the FDA tables; I’ve consolidated them into a single line item. The same change has been made for each of the line items.
When the numbers are consolidated, it is obvious that problems with the topic of “production record review” and “investigation of any unexplained discrepancy” are at the top of the list. As a result, 211.192 moves from third on the FDA list this year and in 2014 to first when all subsets are consolidated — see Table 1. In FY2013, FDA’s tabulation lists 211.192 as second, but again, if all subsets are consolidated it becomes first.Table 1 shows only the most frequent group of inspection observations; the FDA tabulation shows all.
Table 1: Most Common Inspection Observations (2013-2015)
|
Citation |
Short Description |
2015 |
2014 |
2013 |
|
211.192 |
Production record review, investigations of discrepancies |
250 |
209 |
239 |
|
211.160(b) |
Development of scientifically sound specifications |
246 |
165 |
199 |
|
211.42(c) |
Requirement for adequate facilities to prevent contamination or mix-ups |
235 |
125 |
94 |
|
211.22(d) |
Quality unit responsibilities shall be in writing and should be followed |
165 |
148 |
168 |
|
211.113(b) |
Validation of aseptic processes including sterilization |
157 |
109 |
119 |
|
211.166(a) |
Expiration dating shall be supported by appropriate studies |
126 |
82 |
104 |
|
211.100(a) |
Written procedures shall describe production and process controls |
123 |
107 |
135 |
|
211.25(a) |
Staff shall have training, education, and experience to perform their jobs |
119 |
115 |
132 |
|
211.67(a) |
Equipment shall be cleaned and maintained |
113 |
94 |
71 |
|
211.188 |
Batch production records |
110 |
74 |
114 |
|
211.67(b) |
Procedures shall describe cleaning and maintenance of equipment |
91 |
80 |
83 |
|
211.110(a) |
Processes shall be validated |
85 |
74 |
79 |
|
211.165(a) |
Specifications shall be established for drug product |
80 |
64 |
66 |
|
211.68(a) |
Automatic equipment including computers shall be routinely calibrated and inspected |
72 |
64 |
69 |
|
211.100(b) |
Activities shall be documented at the time of performance |
72 |
62 |
84 |
Figure 1 shows the above group of inspection observations graphed over the three fiscal years. While there is some variation from year to year, the frequency with which specific regulations are identified remains fairly constant.


Figure 2 shows additional detail of several areas where the frequency of the observation was higher in FY2015 than in the two previous years. This change could be due to the specific form 483s that were generated within the Turbo-EIR system. Alternatively, it’s possible that they are due to FDA’s intense focus on compounding pharmacy and outsourcing facility inspections. Many of these facilities have inspection observations in these four areas: the absence of scientifically sound specifications, lack of appropriately segregated facility areas to prevent contamination, lack of validation of aseptic processes including sterilization, and expiry dating that is not supported by stability data. It is impossible to know the real reason why the frequency of these citations has increased.

 In conclusion, there is little change in the overall frequency of inspection observations, as characterized by the regulation cited, between FY2013 and 2015. The most frequent observations cite 211.192 (investigations), 211.160(b) (scientifically sound specifications) and 211.42(c) (validation of aseptic processes including sterilization). Where increases in specific observations are noted in Figure 2, it may be due to FDAs focus on inspections of compounding pharmacies and outsourcing facilities, for which these are frequent observations. Data is not available to validate this possible conclusion.
For those interested in a deeper dive into FDA FY2015 inspection observations, please see the LinkedIn article Trend Analysis of 2015 FDA Inspection Data: DRUGS.
Drug GMP Warning Letters
In this section, we turn to drug GMP warning letters in FDA fiscal years 2013 through 2015. Appendices 1 through 3 provide tabulations of warning letters from each of the three years that identify product type covered in the letter, the issuing office, number of deficiencies identified, and the country in which the sites in question are located. Links to each of the warning letters are also provided.
Table 2 shows that the number and percent of warning letters issued to compounding pharmacies increased dramatically between FY2013 and FY2015. This represents an unusual enforcement focus on a single segment of the pharmaceutical industry. FDA’s legal authority over these entities was clarified in the Drug Quality Security Act (DQSA) legislation, signed in November 2013, and explains the apparent explosion of enforcement action. Most of the compounding pharmacies that received these warning letters manufactured sterile injectable products. When removing compounding pharmacies from consideration, Table 2 also shows a dramatic drop in official enforcement actions against pharmaceutical firms in the U.S. and a continued focus on sites OUS. The numbers and percentage, however, have decreased since FY2013. This is perhaps due to the focus on the domestic compounding pharmacy industry.
Table 2: Drug GMP Warning Letters
|
|
FY2013 |
FY2014 |
FY 2015 |
|
Total |
41* |
49** |
42 |
|
Compounding pharmacies |
3 (7%) |
27 (55%) |
24 (57%) |
|
U.S. (non-compounders) |
13 (32%) |
4 (8%) |
3 (7%) |
|
OUS |
25 (61%) |
18 (37%) |
16 (38%) |
|
API sites |
5 |
8 |
9 |
|
Drug product (non-compounders) |
29 |
12 |
9 |
|
API and drug product |
3 |
2 |
1 |
* Includes one repackager not counted as either API or drug product
** Includes one warning letter regarding combination products, considered drug product
The involvement of API sites in warning letters has almost doubled since FY2013. The number of non-compounding drug product sites has decreased by over half, again likely due to the FDA’s focus on compounding pharmacies and outsourcing facilities. As the percentage of warning letters issued to compounding pharmacies has increased, those issued to pharmaceutical manufacturers both inside and outside the U.S. has diminished. This seems to represent FDA’s allocation of its limited inspection resources. Figure 3 shows the high-level data presented in Table 2.
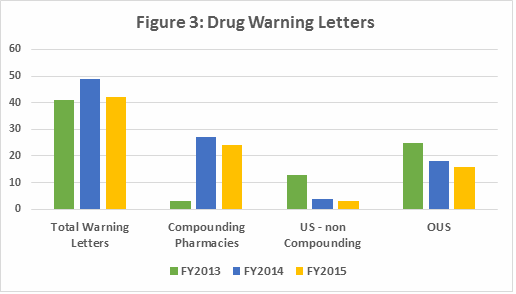

Figure 4 shows data regarding type of manufacturing site associated with warning letters, excluding compounding pharmacies. The focus on API sites has increased and the number of drug product sites has diminished over the time period.

Table 3 shows the geographic distribution of warning letters issued outside the U.S. European countries are counted together since only in one year, FY2013, did any of the countries receive more than one warning letter. European area countries included over the three years include Ireland, Spain, Czech Republic, Italy, Portugal, Denmark, Austria, Netherlands, and Germany. The decrease in warning letters issued to European sites may represent an “unofficial” reliance on EMA inspections of sites located in this area, even in the absence of an official mutual recognition agreement (MRA).
Table 3: Drug GMP Warning Letters Issued Regarding Sites Outside the U.S.
|
Country / Geography |
FY2013 |
FY2014 |
FY2015 |
TOTAL |
|
India |
7 |
7 |
8 |
22 |
|
Europe |
7 |
3 |
3 |
13 |
|
China |
2 |
4 |
2 |
8 |
|
Canada |
4 |
1 |
1 |
6 |
|
Taiwan |
1 |
|
|
1 |
|
Hong Kong |
|
1 |
|
1 |
|
Australia |
1 |
1 |
|
2 |
|
New Zealand |
|
|
1 |
1 |
|
Jamaica |
1 |
|
|
1 |
|
Japan |
2 |
|
|
2 |
|
Mexico |
|
1 |
|
1 |
|
Thailand |
|
|
1 |
1 |
India received the highest number of warning letters issued to a single country, with China coming in second. Over this time period, inspections in China have been limited by the number of visas issued to FDA investigators. Thus, one should not assume the industry in India has more problems than the industry in China. For those who like graphs rather than tables (like me!), Figure 5 shows the same information as Table 3.


Drug GMP Inspection To Warning Letter Issuance Intervals
Last year seemed to show an increase in the interval between inspection and warning letter issuance. Here we provide several years-worth of data to demonstrate this is generally true, with a couple of exceptions. We start with FY2013 and include 1HFY2016. Data is provided for the total number of warning letters, those issued to compounding pharmacies / outsourcing facilities, pharma firms in the US and outside the US. When two or more inspections were mentioned in a warning letter, I took the date nearest to the warning letter issued, under the assumption (perhaps incorrect) that the final inspection provided the incentive that made the warning letter issuance appropriate. When tabulating the individual intervals, they are rounded to the nearest half month.
Table 4 shows the interval between inspections and warning letter issuance for the fiscal years in question. Figure 6 provides a graphic representation of the data. Also see Table 1 for the number of warning letters in each of the FY categories.
Table 4: Interval Between Inspection and Warning Letter in Months
|
|
FY2013 |
FY 2014 |
FY2015 |
1H FY 2016 |
|
TOTAL WLs |
6.7 |
8.8 |
10.3 |
12.4 |
|
Compounding Pharmacies |
3.7 |
10.5 |
10.8 |
12.5 |
|
US sites (non-compounders) |
8.3 |
7.1 |
4.5 |
12.6 |
|
OUS |
6.4 |
6.5 |
10.6 |
12.3 |
In conclusion:
- The average interval between inspection and issuance of all warning letters, and those issued outside the U.S. (OUS), almost doubled between FY2013 and 1HFY2016.
- The average time to warning letter issuance for all drug manufacturer categories, including compounding pharmacies / outsourcing facilities, exceeded 12 months in 1HFY2016.
- The near-doubling of time between inspection and warning letters issued to sites outside the U.S. between FY2014 and 1HFY2016 is dramatic. It is not clear why this is the case. In many of these cases, the warning letters acknowledge that the firms hired third-party consultants to assist in remediation of inspection observations.
- The exception to the increase in time interval is sites in the U.S., likely due to their limited number. FY2014, FY2015, and 1H FY2016 saw four, three, and four warning letters respectively issued to sites in the U.S. FY2013 saw 13 warning letters. The very short duration between inspections and issuance of warning letters for compounding pharmacies in FY2013 was likely due to their small number (three in this case).
Appendix 1: Drug GMP Warning Letters, FY2013
|
Product Type |
Issue Date |
Company Name |
Issuing Office |
Number of Deficiencies |
Country |
|
Repackager |
10/9/2012 |
Atlanta |
3 |
USA |
|
|
Drug product |
10/23/2012 |
Center |
5 |
Canada |
|
|
Drug product |
11/14/2012 |
Center |
6 |
China |
|
|
Drug product |
12/12/2012 |
Center |
2 |
Denmark |
|
|
Drug product |
12/17/2012 |
Center |
3 |
Germany |
|
|
Drug product |
12/17/2012 |
Center |
5 |
Taiwan |
|
|
Drug product |
1/10/2013 |
Dallas |
5 |
USA |
|
|
Drug product |
1/29/2013 |
Dallas |
2 |
USA |
|
|
Drug product |
1/29/2013 |
Center |
6 |
Jamaica |
|
|
Drug product |
2/14/2013 |
Los Angeles |
3 |
USA |
|
|
API |
2/19/2013 |
Philadelphia |
3 |
USA |
|
|
Drug product |
2/20/2013 |
Center |
3 |
Canada |
|
|
Drug product |
2/21/2013 |
Center |
5 |
Canada |
|
|
Compounding pharmacy |
3/7/2013 |
Atlanta |
6 |
USA |
|
|
Drug product |
3/18/2013 |
New Orleans |
5 |
USA |
|
|
API |
3/22/2013 |
New England |
2 |
USA |
|
|
API |
3/22/2013 |
Center |
6 |
Japan |
|
|
Drug product |
3/22/2013 |
Center |
5 |
China |
|
|
Drug product |
3/27/2013 |
Center |
2 |
Italy |
|
|
Drug product |
4/1/2013 |
Center |
4 |
Japan |
|
|
Drug product |
4/25/2013 |
Center |
3 |
Canada |
|
|
Drug product |
4/26/2013 |
Atlanta |
4 |
USA |
|
|
API and drug product |
5/6/2013 |
Center |
4 |
Germany |
|
|
Compounding pharmacy |
5/15/2013 |
Los Angeles |
5 |
USA |
|
|
Drug product |
5/17/2013 |
Center |
3 |
Australia |
|
|
Drug product |
5/28/2013 |
Center |
2 |
Austria |
|
|
API and drug product |
5/28/2013 |
Center |
7 |
India |
|
|
Drug product |
5/31/2013 |
Atlanta |
5 |
USA |
|
|
API |
7/1/2013 |
Center |
4 |
India |
|
|
Drug product |
7/2/2013 |
New Jersey |
4 |
USA |
|
|
API and drug product |
7/3/2013 |
Center |
4 |
India |
|
|
Drug Product |
7/18/2013 |
Center |
6 |
India |
|
|
API |
8/2/2013 |
Center |
3 |
India |
|
|
Drug product |
8/9/2013 |
Center |
2 |
India |
|
|
Drug product |
8/16/2013 |
San Juan |
4 |
USA (PR) |
|
|
Compounding pharmacy |
8/21/2013 |
Atlanta |
6 |
USA |
|
|
Drug product |
8/22/2013 |
Center |
5 |
Spain |
|
|
Drug product |
8/29/2013 |
Center |
21 |
Netherlands |
|
|
Drug product |
8/30/2013 |
Kansas City |
7 |
USA |
|
|
Drug product |
9/4/2013 |
Center |
5 |
USA |
|
|
Drug product |
9/9/2013 |
Center |
7 |
India |
Appendix 2: Drug GMP Warning Letters, FY2014
|
Product Type |
Issue Date |
Issuing Office |
Number of Deficiencies |
Country |
|
|
Drug product |
11/25/2013 |
Center |
4 |
India |
|
|
Drug product |
11/27/2013 |
Seattle |
2 |
USA |
|
|
Drug product |
12/2/2013 |
New Jersey |
6 |
USA |
|
|
Compounding pharmacy |
1/14/2014 |
Los Angeles |
3 |
USA |
|
|
Compounding pharmacy |
1/14/2014 |
Atlanta |
6 |
USA |
|
|
Compounding pharmacy |
1/15/2014 |
New Orleans |
6 |
USA |
|
|
Compounding pharmacy |
1/22/2014 |
Dallas |
5 |
USA |
|
|
Combination product |
1/27/2014 |
Los Angeles |
3 |
USA |
|
|
API |
1/31/2014 |
Center |
6 |
Hong Kong |
|
|
Drug product |
6/2/2014 |
Center |
2 |
India |
|
|
Compounding pharmacy |
2/14/2014 |
Detroit |
5 |
USA |
|
|
Compounding pharmacy |
2/18/2014 |
Florida |
6 |
USA |
|
|
Compounding pharmacy |
2/19/2014 |
New England |
7 |
USA |
|
|
Compounding pharmacy |
2/21/2014 |
New Jersey |
8 |
USA |
|
|
API |
2/27/2014 |
Center |
4 |
India |
|
|
Compounding pharmacy |
2/28/2014 |
New England |
4 |
USA |
|
|
Compounding pharmacy |
2/28/2014 |
New Orleans |
6 |
USA |
|
|
API |
3/6/2014 |
Center |
3 |
India |
|
|
Compounding pharmacy |
3/7/2014 |
Philadelphia |
2 |
USA |
|
|
Drug product |
3/18/2014 |
Center |
3 |
Ireland |
|
|
API/drug product |
4/11/2014 |
Center |
6 |
Germany |
|
|
Drug product |
4/16/2014 |
Center |
15 |
Mexico |
|
|
Drug Product |
4/21/2014 |
Center |
8 |
USA |
|
|
Compounding pharmacy |
4/30/2014 |
Atlanta |
8 |
USA |
|
|
Compounding pharmacy |
5/2/2014 |
San Francisco |
5 |
USA |
|
|
Compounding pharmacy |
5/2/2014 |
Minneapolis |
7 |
USA |
|
|
API and drug product |
5/7/2014 |
Center |
5 |
India |
|
|
Compounding pharmacy |
5/9/2014 |
Atlanta |
7 |
USA |
|
|
Compounding pharmacy |
5/27/2014 |
Dallas |
6 |
USA |
|
|
Compounding pharmacy |
6/6/2014 |
Dallas |
3 |
USA |
|
|
API |
6/10/2014 |
Center |
3 |
China |
|
|
Drug product |
6/12/2014 |
Center |
5 |
Canada |
|
|
API |
6/16/2014 |
Center |
4 |
India |
|
|
Compounding pharmacy |
6/23/2014 |
New Jersey |
8 |
USA |
|
|
Compounding pharmacy |
6/27/2014 |
Atlanta |
1 |
USA |
|
|
Compounding pharmacy |
7/7/2014 |
Kansas City |
1 |
USA |
|
|
API |
7/7/2014 |
Center |
3 |
Italy |
|
|
Drug product |
7/8/2014 |
Center |
6 |
India |
|
|
API |
7/9/2014 |
Center |
4 |
China |
|
|
Compounding pharmacy |
7/14/2014 |
Cincinnati |
1 |
USA |
|
|
Compounding pharmacy |
7/18/2014 |
Chicago |
12 |
USA |
|
|
Compounding pharmacy |
8/12/2014 |
Florida |
6 |
USA |
|
|
Compounding pharmacy, animal drug |
8/14/2014 |
Cincinnati |
1 |
USA |
|
|
Compounding pharmacy |
8/15/2014 |
Los Angeles |
6 |
USA |
|
|
Compounding pharmacy |
9/4/2014 |
New Orleans |
7 |
USA |
|
|
Drug product |
9/19/2014 |
Center |
4 |
China |
|
|
Compounding pharmacy |
9/24/2014 |
Detroit |
7 |
USA |
|
|
Drug product |
9/26/2014 |
Center |
3 |
Australia |
|
|
API |
9/29/2014 |
Center |
1 |
China |
Appendix 3: Drug GMP Warning Letters, FY2015
|
Product Type |
Issue Date |
Company Name |
Issuing Office |
Number of Deficiencies |
Country |
|
API |
10/15/2014 |
PHS/Center |
3 |
India |
|
|
API |
10/15/2014 |
PHS/Center |
3 |
India |
|
|
Drug product |
10/21/2014 |
PHS/Center |
2 |
Portugal |
|
|
Compounding pharmacy |
10/23/2014 |
Baltimore |
4 |
USA |
|
|
Compounding pharmacy |
10/24/2014 |
New England |
4 |
USA |
|
|
Compounding pharmacy |
10/29/2014 |
Florida |
1 |
USA |
|
|
Compounding pharmacy |
11/11/2014 |
Florida |
6 |
USA |
|
|
Cell therapy (drug product) |
11/20/2014 |
New York |
6 |
USA |
|
|
Compounding pharmacy |
12/9/2014 |
New Orleans |
4 |
USA |
|
|
API and dosage form |
12/19/2014 |
PHS/Center |
4 |
China |
|
|
Drug product |
1/9/2015 |
PHS/Center |
4 |
India |
|
|
Compounding pharmacy |
1/21/2015 |
Dallas District |
4 |
USA |
|
|
Compounding pharmacy |
1/27/2015 |
Seattle |
6 |
USA |
|
|
Drug product |
1/30/2015 |
PHS/Center |
4 |
India |
|
|
Compounding pharmacy |
2/13/2015 |
New York |
5 |
USA |
|
|
API |
2/27/2015 |
PHS/Center |
3 |
Thailand |
|
|
Compounding pharmacy |
3/27/2015 |
New York |
3 |
USA |
|
|
Compounding pharmacy |
3/27/2015 |
New York |
6 |
USA |
|
|
Drug product |
3/31/2015 |
Center |
4 |
Italy |
|
|
Dosage form, PADE + GMP |
4/3/2015 |
Seattle |
2 |
USA |
|
|
API |
4/6/2015 |
Center |
3 |
China |
|
|
Compounding pharmacy |
4/8/2015 |
Center |
6 |
USA |
|
|
Compounding pharmacy |
4/14/2015 |
San Francisco |
6 |
USA |
|
|
Compounding pharmacy |
4/21/2015 |
Dallas |
6 |
USA |
|
|
Compounding pharmacy |
4/27/2015 |
Florida |
6 |
USA |
|
|
Compounding pharmacy |
4/27/2015 |
Florida |
7 |
USA |
|
|
Compounding pharmacy |
4/29/2015 |
Cincinnati |
6 |
USA |
|
|
Compounding pharmacy |
5/14/2015 |
Florida |
4 |
USA |
|
|
API |
5/27/2015 |
Center |
2 |
Czech Republic |
|
|
Compounding pharmacy |
6/4/2015 |
New Orleans |
5 |
USA |
|
|
Finished pharmaceutical (medical gas) |
6/8/2015 |
Atlanta |
2 |
USA |
|
|
Compounding pharmacy |
6/17/2015 |
Los Angeles |
5 |
USA |
|
|
API |
6/22/2015 |
Center |
1 |
Canada |
|
|
Compounding pharmacy |
6/25/2015 |
Dallas |
3 |
USA |
|
|
Compounding pharmacy |
7/6/2015 |
Florida |
4 |
USA |
|
|
API |
7/23/2015 |
Center |
2 |
India |
|
|
Compounding pharmacy |
8/11/2015 |
Detroit |
3 |
USA |
|
|
Drug product |
8/16/2015 |
Center |
9 |
India |
|
|
Compounding pharmacy |
8/31/2015 |
Detroit |
8 |
USA |
|
|
API |
9/2/2015 |
Center |
3 |
India |
|
|
Dosage form |
9/4/2015 |
Center |
4 |
New Zealand |
|
|
API |
9/28/2015 |
Center |
4 |
India |
|
|
Compounding pharmacy |
9/29/2015 |
Philadelphia |
4 |
USA |
About The Author
Barbara Unger formed Unger Consulting, Inc. in December 2014 to provide GMP auditing and regulatory intelligence services to the pharmaceutical industry. She has extensive expertise in this area having developed, implemented, and maintained the GMP regulatory intelligence program for eight years at Amgen Inc. This included surveillance, analysis, and communication of GMP related legislation, regulations, guidance, and industry compliance enforcement trends. Barbara was the first chairperson of the Rx-360 Monitoring and Reporting work group (2009 to 2014) that summarized and published relevant GMP and supply chain related laws, regulations, and guidance. She also served as the chairperson of the Midwest Discussion Group GMP-Intelligence sub-group from 2010 to 2014.
Before Amgen, Barbara worked for the consulting firm Don Hill and Associates, providing regulatory and quality services to the pharmaceutical industry, and for Eli Lilly and Company in quality and CMC regulatory affairs positions. She began her career in the pharmaceutical / device industry with Hybritech Inc. and received a bachelor's degree in chemistry from the University of Illinois in Urbana Illinois.