
A Quantitative Benefit-Risk Analysis & Benefit-Risk Ratio Using Real World Data: Part 2 — COVID-19 Vaccine Benefit-Risk
By Jayet Moon, Veronica Stephens, and Kylee Rogers

In the previous article, we presented a method by which benefit-risk analysis can be objectively carried out to arrive at a benefit-risk ratio. This method can be applied to any medical therapy, and this article provides a very relevant and contemporary example of how it can be used to calculate COVID-19 vaccine benefit-risk.
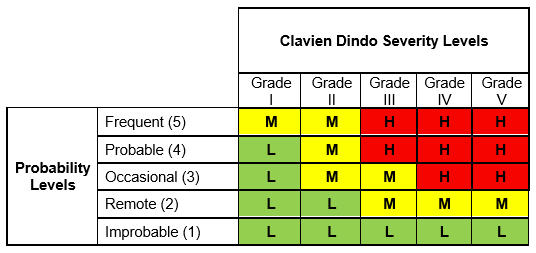
To recap, we used five Clavien Dindo severity levels along with a five-level probability scale to construct a Clavien Dindo risk matrix as shown in Table 1:
Table 1: Risk Matrix with Severity, Occurrence, and Risk Levels
We use the following equation for risk, where W is the weighting factor:

For purposes of this analysis, W =2, x= 2, and y=1.

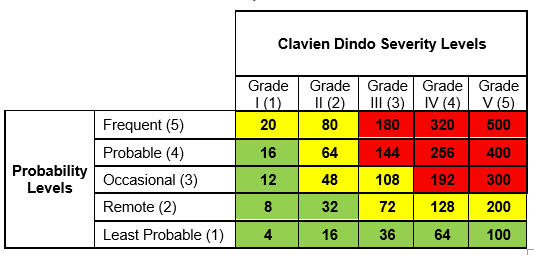
The basis for choosing these variables should be the degree of resolution needed in the spectrum of risk calculations. The maximum level of severity and occurrence per the five-level scales defined in this paper is 5. Hence, the lowest level of risk product per the equation is 4, while the highest is 500. In this case, we chose W=2, x=3, and y=1; the lowest level of risk would be 8 and the highest, 5,000, producing a ten-fold increase in the risk range.
Even though we have three levels of risk in High, Medium, and Low, this quantification allows us to identify a unique quantified value of risk for each unique combination of severity and occurrence levels. This will prove crucial in the calculations ahead. Determining the probability through Table 2 and the severity through Table 1 allows us to find the unique quantification value in Table 3. Thus, the risk levels in the risk matrix, using the formula above, can be quantified as follows:
Table 2: Occurrence Scale
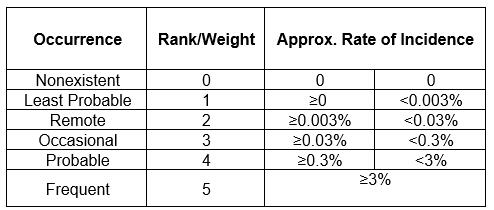
Table 3: Quantification Matrix
Our aim is to carry out a benefit-risk analysis on two COVID-19 vaccines. Toward this goal, we need the following data:
- Adverse events associated with vaccines (consider vaccination as preventive therapy) and their occurrence rates and severities separated by each manufacturer to be analyzed
- Adverse events associated with the disease (COVID-19) for the unvaccinated and their occurrence rates and severities
This data will provide us with the risk of therapy and risk of illness without therapy.
We will be analyzing these events and rates in the U.S. state of Utah, whose data on vaccine administration is publicly available through the Centers for Disease Control (CDC).1 Additional data on hospitalizations, ICU admissions, and death until March 7, 2021, is available through covidtracking.com.2 The vaccine-related adverse events are also publicly available on the VAERS3 database through CDC WONDER. Before we present collected data, here are a few caveats:
- These are not statistical samples; they are real-world data from Utah.
- The VAERS WONDER database was searched on Sept. 9, 2021. There may be a lag of up to 10 days in the updating of this database, which may cause minor inaccuracies.
- To truly get data around hospitalizations, ICU admissions, and deaths for the unvaccinated population with COVID-19, data was pulled from a time before a vaccine was available or approved. Thus, the “unvaccinated” COVID cases and outcomes are counted from the beginning of the pandemic until Nov. 20, 2020. However, since we are converting the gross data into a normalized percentage figure, the impact will be minimal.
- The VAERS database has a small number of events associated with “unknown” vaccines; we have not counted those.
- The VAERS category of Permanent Disability has been considered a Grade IV Clavien Dindo harm.
- Low-severity Grade I and II harms for COVID cases from Utah were not available. These have been omitted and thus the combined risk score for “risk of illness” will be lower than expected.
Now that we have set the ground rules, let’s analyze the data using the following steps:
- Collect data around all grades of harms for four categories of analysis: all vaccinated populations (severity of harms associated with each dose of vaccination), population vaccinated with Moderna, population vaccinated with Pfizer-BioNTech, and the unvaccinated population that never came into contact with a vaccine or vaccinated person (free disease transmission before vaccine introduction).
- Calculate the percentage of occurrence of adverse events for each grade of Clavien Dindo harm.
- Based on the occurrence rate, Clavien Dindo grade, and the likelihood and severity tables presented in part one of this article, identify the risk level of each set of severity and occurrence. Note the associated risk level number (highlighted in yellow in the table below).
The output of these steps is shown in Table 4.
Table 4: Real-World Risk Occurrence, Risk Level and Risk Score Calculation
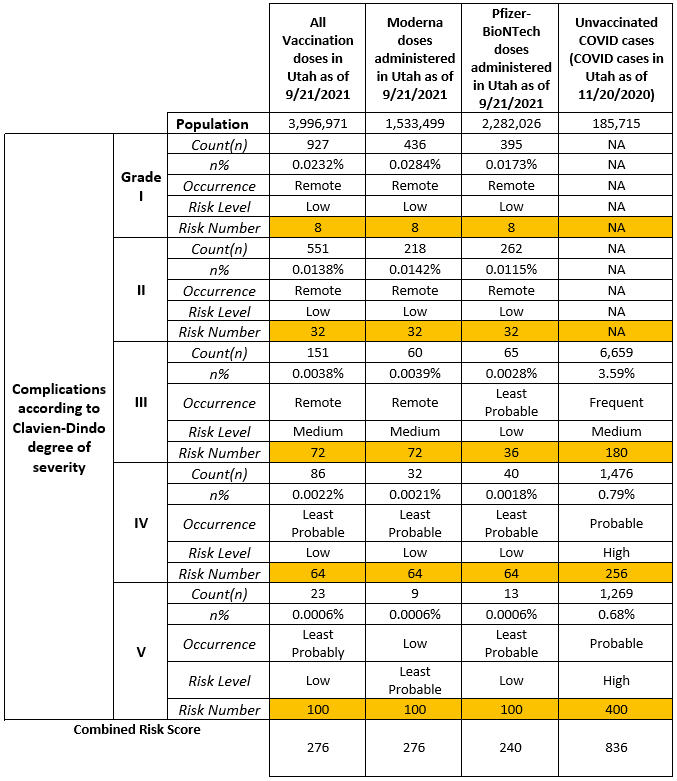
As seen in the last column in the table above, the risk of illness (COVID-19 disease for an unvaccinated individual) is the sum of risks related to all Clavien Dindo grades for the illness. Thus, the risk of illness will be:

For the risk of illness, values of Grade I and II harms have not been assigned due to a lack of available data. This risk score therefore is lower than it should be, based on the best available data.
To calculate the benefit-risk score, the following formula is used

A benefit-risk score greater than 1 indicates that benefits outweigh the risk of therapy and the greater the magnitude, the greater the risk-benefit.
For the vaccines under analysis, the following values are obtained:
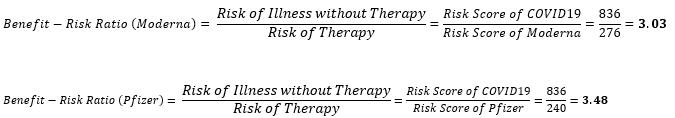
The difference in risk of therapy for the Pfizer-BioNTech vaccine over Moderna was found to be 36 points, while the difference in benefit-risk ratio was 0.45. To explain this graphically, these scores are plotted on Figure 1 below.
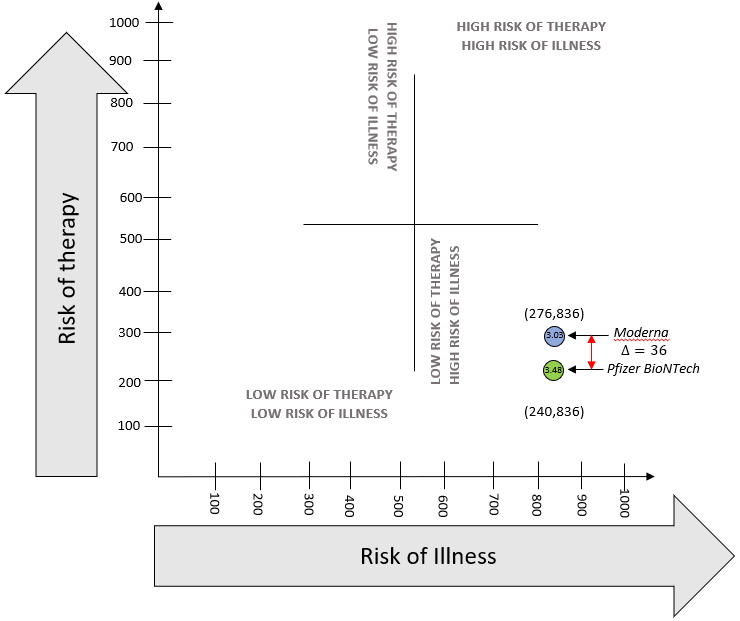
Figure 1: Graphical Visualization of aggregate Benefit-Risk
Despite intense regulatory focus on benefit-risk analyses for medical drug, device, and therapy clearance/approval, it must be understood that this is a dynamic and repetitive exercise that provides relative and comparative levels of risk with best available data at the time rather than its ultimate quantification. Risk assessment is a stochastic process and all tools used are susceptible to uncertainties related to prediction. This benefit-risk tool aims to reduce this susceptibility by using a structured risk logic with a standardized severity classification scale and a risk matrix with added graphical visualization.
The tool in this study leverages the Clavien Dindo classification, which has been already used numerous times in conjunction with univariate inferential analysis to demonstrate comparative degrees of difference.4 The Clavien Dindo classification has proved to be naturally suited to the structure of risk matrix and consequent risk score calculations. The advantage of tying together the line-based (by each grade of harm) univariate analysis using the risk matrix demonstrated in this paper is that a single numeric value can be used to assess aggregate benefit-risk.
According to Edwards (1996),5 two of the three principles of benefit-risk (incidence and seriousness) are explicitly addressed using occurrence and severity in the risk matrix approach. Since the endpoint severities are considered for differing occurrence rates, the impact of the third principle of duration is implicitly captured by the frequency and severity scales. One cannot bleed for a longer duration without a change in the Clavien Dindo grade of harm.
Mussen (2007)6 recognized that weighing short-term benefits over long-term risks and considering multiple benefits with multiple risks concurrently is an important complicating factor. The risk matrix approach mitigates these problems inherent in the current benefit-risk practices to a large extent. The five-level occurrence scale with the concept of “risk of illness without therapy” forces the practitioner to think broadly to include all probabilities of end events over all levels of severities for both illness and treatment.
The method used in this paper also lends itself to graphical visualization, thereby providing an opportunity to track the change in benefit-risk as more information becomes available or if further studies are conducted. A common application is the comparison of premarket studies for therapies to post-market clinical studies to assess differences in benefit-risk as shown in Figure 1. Long-term effectiveness of one or multiple therapies can be plotted graphically. In addition, since the method extrapolates the individual harms to benefit-risk without mathematical complications, the root causes of change in benefit-risk can be isolated for further analysis.
The variables W, x, and y in the risk equation can be customized per the level of detail required by practitioners and the nature of the therapy under study. Keeping W, x, and y as 1 will result in the default and most simple version of this method. This custom weighting affords further flexibility to this tool for broad usage in healthcare applications.
The method in this paper provides an objective and categorical tool that satisfies the need for comparative analysis, but it is not definitive, and this output may be complemented by further analyses. While this method generates a bona fide numerical benefit-risk ratio, practitioners of this method must understand that this is semi-quantitative. It is still prone to uncertainty errors of imprecision and variability. The key in any benefit risk analysis is to ensure that data of highest quality is continually used to update it. This is not a one-time exercise but a scientific method to be used for continued vigilance.
References
- https://coronavirus-dashboard.utah.gov/vaccines.html
- https://covidtracking.com/data/state/utah/hospitalization
- https://vaers.hhs.gov/data.htm
- Lee, J. H., Park, D. J., Kim, H. H., Lee, H. J., & Yang, H. K. (2012). Comparison of complications after laparoscopy-assisted distal gastrectomy and open distal gastrectomy for gastric cancer using the Clavien–Dindo classification. Surgical endoscopy, 26(5), 1287-1295.
- Edwards, I. R., Wiholm, B. E., & Martinez, C. (1996). Concepts in risk-benefit assessment. Drug safety, 15(1), 1-7.
- Mussen, F., Salek, S., & Walker, S. (2009). Benefit-risk appraisal of medicines. A systematic approach to decision-making.
About The Authors:
 Jayet Moon earned a master’s degree in biomedical engineering from Drexel University in Philadelphia and is a Project Management Institute (PMI)-Certified Risk Management Professional (PMI-RMP). Jayet is also a Chartered Quality Professional in the UK (CQP-MCQI). He is also an Enterprise Risk Management Certified Professional (ERMCP) and a Risk Management Society (RIMS)-Certified Risk Management Professional (RIMS-CRMP). He is a Fellow of the International Institute of Risk & Safety Management. His new book, Foundations of Quality Risk Management, was recently released by ASQ Quality Press. He holds ASQ CQE, CQSP, and CQIA certifications.
 Veronica Stephens is the senior vice president of quality and risk management solutions for the firm Auchincloss-Stephens. She is a risk management subject matter expert with over two decades of experience in Fortune 500 companies across a range of industries, including pharmaceuticals, food production, consumables, durables, and medical devices.
 Kylee Rogers is the owner and founder of Intuitive Quality Consulting, providing risk assessments and product specification recommendations for infant and juvenile products. She is also a supplier quality professional with Young Living. With a CQA and a CSQP with the American Society for Quality, her background is in nutrition, dietary supplements, and OTC products. She serves as a co-chair for the ASQ Global NextGen Advocacy Sub-Committee and as arrangements chair for her local chapter. She predicts receiving her B.S. in business management in the spring of 2022.