
Biosimilar Pipeline Experiencing 12% Annual Growth: A Progress Update
By Ronald A. Rader, BioPlan Associates, Inc.
This article compares aspects of the biosimilar development pipeline and related market evolution over the past seven  years, since 2013, including what has and hasn’t changed. The data presented here is derived from the Biosimilars/Biobetters Pipeline Directory.1 The Pipeline database currently reports 801 companies worldwide involved in biosimilars development, manufacturing, and/or marketing.*
Progress has been made in terms of scientific, industry, healthcare community, and public knowledge about biosimilars. There is now widespread acceptance, including by healthcare professionals, that products approved as biosimilars can be used instead of their reference products. Major progress has been made in healthcare professional, industry, and regulatory confidence in the ability to prove that biopharmaceuticals from different sources, with different bioprocessing, are “biosimilar” based primarily on analytical methods supported by basic comparative bioequivalence/pharmacokinetic (PK) clinical trials.
Biosimilar approvals are now becoming routine and related technology rather common and considered nothing special. Several dozen FDA, and even more EMA/European Union, approvals and years of biosimilar use now attest to this. Biosimilarity testing is now routinely offered by almost every major CRO, and product/process development and manufacturing services are similarly routinely offered by almost every major CMO. And biosimilar development continues to expand, with ever more products and players.
Biosimilars Remain New And Immature
Back in 2013, the “genuine” biosimilar market (versus biogenerics, which can be considered those not rigorously tested or approved, or those produced in developing markets and not meeting GMP) was essentially just the European Union, with revenue at most $0.5 billion/year. Now, the total biosimilar market is over 10 times that, with >$6 billion in revenue. This now includes growing markets in the U.S. and other major market countries. The EU remains the leading major market for biosimilars, in terms of biosimilar approvals and market size/revenue, and it is by far the major revenue source. Despite the large number of international biogenerics, with more of these than genuine biosimilars, these remain just a small portion in terms of revenue, likely ≤15 to 20 percent.
Currently, only limited information about biosimilar products, including what they are and their bioprocessing, is sometimes disseminated or published. This may change, as major market developers have put in extra effort to make a “better,” e.g., purer, product. These developers see a need to report their in-depth analytical product comparisons. Currently, such biosimilar comparative and bioprocessing descriptive data is rarely disclosed, despite this being the primary basis for approvals.
Biosimilar approvals continue to be treated as novel; however, such products and approvals are not new, and many fail to consider biosimilars in a broader biopharmaceutical historical context. Most biologics historically have been approved with full generic drug-like equivalence and even formal interchangeability. Most vaccines and blood products continue to routinely be approved (through BLAs) based on comparative trials, including meeting surrogate markers of efficacy versus a marketed product, not extensive Phase 3 trials. And formal interchangeability is common, including regimens that started with one product able to switch to use another product with the same generic name. For example, it is common for product inserts to allow mixing doses of the “same” vaccines or blood products in the same regimen, such as diphtheria vaccine or leukocytes from different sources. Public discussions concerning approvals of interchangeable biosimilars would likely benefit from considering the context of 120 years of biologics regulation (in the U.S.).
Other concerns exist, such as the possibility that U.S. biosimilar regulation could be negated. For example, the Trump administration has brought a case before the Supreme Court seeking to throw out the Affordable Care Act (ACA or Obamacare). If this is upheld, it would include eliminating the biosimilar regulations in the act. In the worst case, biosimilar legislation may have to be redone by Congress. Decision makers and investors tend to avoid market segments with this kind of instability.
Patents Control Market Entry
Patents continue to be the major bar to biosimilar market entry, particularly in the U.S., which is by far the largest single potential market for biosimilars. In fact, the majority of FDA-approved biosimilar products remain off the U.S. market. Their launch is delayed until after expiration of reference product company patents, increasingly after market entry dates are negotiated by biosimilar developers with patent holders (reference product manufacturers). Patents continue to fully determine U.S. marketability, with the 12-year exclusivity protection from biosimilar approvals, seven-year orphan, and other government-granted exclusivities granted to reference products having essentially no impact on U.S. market entry of biosimilars and other biopharmaceutical products. Patents generally protect U.S. reference products for >15 years, and this is increasing as even broader patent “thickets” are built around reference products, proving difficult for biosimilar developers to avoid.
Activists, politicians, patient groups, etc. in the U.S. continue to periodically call for a decrease in the exclusivity afforded originator reference products. This is presumed to allow earlier market entrance of biosimilars, which would increase competition and lower prices. However, marketed biopharmaceuticals’ patent protection is effectively increasing toward >20 years. The proposed changes to laws and regulations suffer from a lack of studies showing that shorter U.S. exclusivity periods will result in faster biosimilar market entry. Even if exclusivity were eliminated — reduced to zero — biosimilars would not enter the U.S. market quicker. Calls for legislation shortening reference product exclusivity sound good to those seeking lower prices, but it will have little real-world impact. Patent challenges by reference product manufacturers directed to almost every new biosimilar approaching approval will continue. And marketing of biosimilars in the U.S will likely, for at least the next few years, remain dominated by Big (Bio) Pharma companies willing and able to take on these patent disputes. There are few small companies among the marketing pioneers in major markets.
Pipeline Changes, 2013-Present
Figure 1 portrays the overall biosimilar pipeline status in March 2013 and March 2020, a seven-year difference. The statuses shown reflect the latest stage a biosimilar (here including biogenerics as a subset) has attained in any country worldwide.
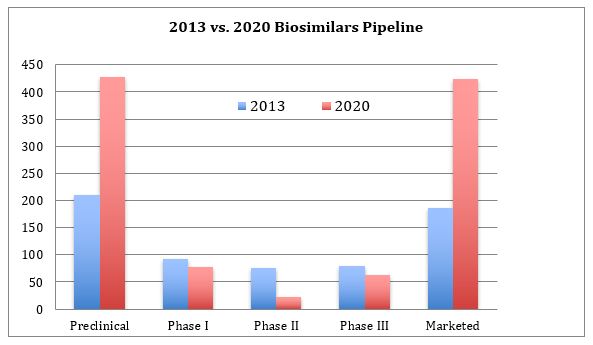
Figure 1: The biosimilar pipeline by phases of development, 2013 and 2020
The total number of biosimilars in the Pipeline database has grown 208 percent, from 514 in 2013 to the current 1,071. The number of marketed biosimilars has increased 226 percent in the past seven years. The current number of biosimilars in preclinical phase now vs. 2013 has similarly increased by 200 percent.
Both the 2013 and 2020 pipelines present symmetrical distribution patterns with peaks at preclinical and marketed and troughs in the mid-trial phase, but with significant increases now in the numbers at the two ends of the pipeline. More marketed products and more products entering development indicate a healthy, growing pipeline and industry sector. The largest portion, but less than half, of pipeline products remain in the preclinical phase. This is normal for most pharmaceutical pipelines. What is unusual is that it is very rare for companies to report dropping biosimilar development, particularly when these have not advanced into trials. This is likely counterbalanced by developers not reporting their pipeline products until they enter trials. That is, some preclinical candidates are remaining trade secrets.
The distribution of phases of development is shown in Figure 2 for the numbers of products being initially targeted to major markets (U.S., EU, and some other developed, highly regulated countries). This includes genuine biosimilars (vs. those products primarily targeted to non-major, lesser-regulated international markets). We note that nearly all biogenerics target their marketing toward developing countries (thus they do not receive formal biosimilar approvals and do not meet GMP). The major markets shown are genuine biosimilars, while nearly all those in other markets are lesser-regulated biogenerics.
The numbers and proportions of products in premarketing phases of development in both major and minor markets are rather similar. However, the average number of pipeline products is generally much larger for biogeneric developers, with most claiming a much broader portfolio compared to companies with genuine GMP-grade, formally approved biosimilars. Generally, products are being targeted for initial marketing in either major or other markets, with only 33 of >1,000 biosimilars indexed as their initial development targeting both major and other markets.

Figure 2: Current major market vs. other/international market biosimilar pipelines
Much as the biopharmaceutical market continues to grow at rather steady rates — ~12 percent annually, nearly doubling every five years — the number of biosimilars in the pipeline targeting each potential reference product has continued to increase. Table 1 shows the number of biosimilars in 2013 and now targeting specific reference products or product classes, sorted by the current number in the pipeline. All of these products and classes now are blockbusters with multi-billion-dollar annual revenue. Note, 55 percent of biosimilars are now targeting cancer indications and ~40% are monoclonal antibodies or derivatives.
Table 1: Increases in Pipeline for Biosimilars Targeting Specific Reference Products and Classes
|
Ref. Product or Product Class |
2013 |
2020 |
7-year % Increase |
|
Cancer-targeted biosimilars |
351 |
593 |
69% |
|
MAbs and antibody fragments |
146 |
424 |
190% |
|
Interferons (alfa) |
55 |
186 |
238% |
|
TNF mAbs/inhibitors |
44 |
121 |
175% |
|
Epogen/Procrit (epoetin alfa) |
69 |
97 |
41% |
|
Insulin and analogs |
40 |
85 |
113% |
|
Neupogen (filgrastim) |
52 |
69 |
33% |
|
Rituxan (rituximab) |
30 |
62 |
107% |
|
Herceptin (trastuzumab) |
24 |
60 |
150% |
|
Avastin (bevacizumab) |
14 |
57 |
307% |
|
Humira (adalimumab) |
13 |
51 |
292% |
|
Somatropins |
28 |
43 |
54% |
|
Neulasta (pegfilgrastim) |
14 |
40 |
186% |
|
Enbrel (etanercept) |
21 |
40 |
90% |
|
Interferons (beta) |
23 |
32 |
39% |
|
Lucentis (ranibizumab) |
2 |
20 |
900% |
|
Remicade (infliximab) |
9 |
20 |
122% |
|
Lantus (insulin glargine) |
5 |
17 |
240% |
|
Aranesp (darbepoetin alfa) |
4 |
12 |
200% |
|
Factor VIII, recombinant |
4 |
8 |
100% |
|
Total |
948 |
2,037 |
115% |
The seven-year increase in biosimilars for all products and classes is 115 percent over time, or ~12 percent/year CAGR. The largest increases in the pipeline in terms of product classes are those targeting cancer indications, monoclonal antibodies and fragments/derived products, interferon alpha products, and tumor necrosis factor (TNF) mAbs and other inhibitors. The reference product/class with the largest percent growth is Lucentis, followed by much lower percentage growth for Avastin and Humira
Biogenerics Dominate, Number-Wise
The most dramatic change in recent years has been in the number of marketed products, including biogenerics, which outnumber genuine (major market approved/approvable, GMP-meeting) biosimilars. Nearly all the non-major-targeted marketed products (lesser-regulated markets) are biogenerics. Some of these are virtual, in the sense that they are marketed but often never actually manufactured until orders are placed; in some cases, a biogeneric company may only be selling a manufacturing technology transfer package. Much of this international trade in biogenerics involves manufacturers essentially acting as CMOs filling lowest-bid proposals from RFPs issued by countries and regional health authorities in developing countries. In some cases, this includes the product never having been evaluated, much less receiving approval, by any country’s regulatory authority and no clinical trials being conducted.
Many biogenerics qualify for purchase by authorities in some developing countries by simply meeting a standard of identity, as defined in a pharmacopeia or being assigned the same generic active agent name (INN, or international nonproprietary name) and showing lack of contamination or other readily detectable problems. Despite published reports that many biogenerics clearly are not biosimilar (different mix of molecular variants or don’t meet GMP standards, etc.), the industry has avoided major public health problems attributed to biogenerics (although many countries using biogenerics lack the ability to collect and report adverse events). The WHO/United Nations had proposed, but for the moment have abandoned, a plan to establish a worldwide biosimilar tracking system. In some respects, this might support and legitimize low-end biogenerics by registering them along with other biosimilars.
Regional Factors
The Pipeline database currently reports a total of 801 companies worldwide involved in biosimilar development, manufacturing, and/or marketing. The 2013 and current distribution of companies involved with biosimilars, whether as developers, manufacturers, or marketers, by region and some countries, are shown in Figure 3. Companies are assigned to countries based on where their headquarters are located.
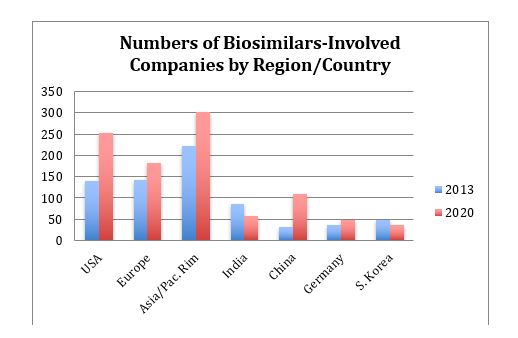
Figure 3: Companies involved with biosimilars by location, 2013 and 2020
The largest increases, where more companies entered the field in recent years, are in the U.S. and Asia/Pacific Rim. Most of the new Asian entrants are in China, and China has the largest percentage growth.
The numbers of biosimilars (in the broadest sense) associated with companies by their region or country in 2013 and 2020 are shown in Figure 4. Developers based in major market/developed countries tend to have much smaller portfolios or be much more modest in their claims for having biosimilars in development compared to those in developing countries, with these companies tending to report larger portfolios being targeted. For example, the ratio of products to companies is close to 1:1 for the U.S. and >2:1 for Asia/Pacific Rim. Another trend is for more companies becoming involved with each biosimilar, with an average of ~3.5 companies now involved with each product, including more marketing licensees in different territories and CMO or third-party manufacturing.
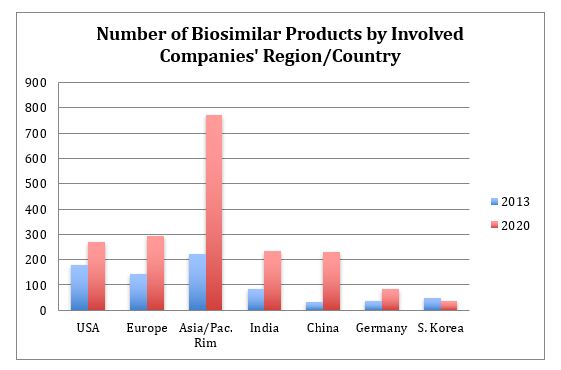
Figure 4: Biosimilar pipeline products by the location of involved companies, 2013 and 2020
The region with the largest number of new biosimilars, those entering the pipeline since 2013, is Asia/Pacific Rim, with China having the largest percentage growth and now having a biosimilar development pipeline comparable to that of India. We expect further significant growth in China as its biopharmaceutical industry accelerates its growth relative to India, and we expect China to eventually significantly surpass India as a manufacturer of both biogenerics and Western-targeted biosimilars.
Conclusion
Biosimilars in development and marketed, including both those targeted to major highly regulated markets and biogenerics targeted to less- and non-regulated international markets, continue to steadily increase. We can expect many more biosimilars to enter world markets in coming years. Competition among companies for key markets for their biosimilar products will also increase, and it is likely the number of biosimilar-involved companies will level out or possibly decline as less-qualified competitors exit the segment.
* Note: This article refers to the Pipeline database, which includes generic drug (505(b)(2) or NDA) approvals by the FDA, such as those granted to insulins and other products that started out as drugs (natural products vs. now being biotech-derived), with these approvals in the process of being converted by the FDA to biologics (BLA) approvals.
References:
1. Rader, R.A., Biosimilars/Biobetters Pipeline Database, BioPlan Associates, at www.biosimilarspipeline.com. Rockville, MD; +1 301 921 5979
About The Author:
 Ronald A. Rader is senior director, technical research, BioPlan Associates. He has 35+ years’ experience as a biotechnology and pharmaceutical, particularly biopharmaceutical, information specialist, analyst, and publisher. He has been responsible for publications/information resources including the Antiviral Agents Bulletin periodical, the Federal Bio-Technology Transfer Directory, BIOPHARMA: Biopharmaceutical Products in the U.S. and European Markets, and the Biosimilars/Biobetters Pipeline Directory. He can be contacted at info@bioplanassociates.com, 301-921-5979, and www.bioplanassociates.com.