
Cleaning Process Development: Using Design Of Experiments To Determine Critical Process Parameters
By Ruijin Song and Andrew Walsh

Part of the Cleaning Validation For The 21st Century series
The publication of the ASTM (American Society for Testing and Materials) E3106 Standard Guide for Science-Based and Risk-Based Cleaning Process Development and Validation1 in 2018 brought an increased emphasis on performing cleaning process development studies prior to any validation efforts. ASTM E3106 emphasized that cleaning agents and cleaning processes should not be adopted randomly, nor should they be chosen simply based on what has been used in the past or is used at other facilities. Cleaning processes must be developed with the intent of reducing the risk of cross contamination and identifying appropriate cleaning parameters for both the type of compound/product and the equipment or medical device to be cleaned. This includes the type of, and the need for, cleaning agents.
Recently, an article by Bloomberg2 discussed how cross contamination of drug products appears to be widespread in the pharmaceutical industry, which in many cases is clearly related to inadequate cleaning processes, and this is putting patients and consumers at risk. Cleaning processes should have their critical cleaning parameters identified and optimized as this will reduce cleaning process residues to the lowest levels and provide the highest level of safety to patients. While these important goals may sound daunting and require excessive efforts, they can actually be achieved in a short amount of time and with a minimal amount of energy and resources, if the science-, risk-, and statistics-based approaches of ASTM E3106 are used.
Cleaning process development should begin in the laboratory with bench-scale testing to gain the initial cleaning process knowledge and understanding necessary to facilitate their transfer and application to commercial scale. ASTM has two standards originally for use in oxygen service, the ASTM G122 Standard Method for Evaluating the Effectiveness of Cleaning Agents and Processes3 and the ASTM G121 Standard Practice for Preparation of Contaminated Test Coupons for the Evaluation of Cleaning Agents4 that were recently updated to include pharmaceuticals and medical devices in scope.5 There are many methods for laboratory-scale studies that can be performed quickly and easily that will assist in cleaning process development using simple cleanability studies.
Such laboratory-scale studies are rapid and economical and can provide valuable insights into the cleaning process. Additionally, laboratory-scale studies can provide answers to typical cleaning validation questions such as:
- Which product is the “hardest to clean”?
- Which cleaning agent provides the best cleaning (and are they necessary)? 4
- Can we demonstrate that two cleaning agents are equivalent? 4
- Which cleaning input parameters are critical?
- What are the optimal cleaning parameter settings?
- How long does it take to clean the equipment? 5
- Are dirty hold time studies necessary at commercial scale?
These seven questions were posed in our first article6 in this series on cleaning process development and questions 1, 2, 3, and 6 were answered in the first three articles.6-8 This article will address questions 4 and 5.
Question 4: Which Cleaning Input Parameters Are Critical?
Many years ago (1959) Dr. Herbert Sinner of Henkel, a large detergent manufacturer, proposed four factors that affect cleaning: 9
- time
- action (agitation/mechanical)
- chemistry (cleaning agent)
- temperature
Sinner also proposed that a reduction in one factor could be offset by an increase in one or more of the other factors. This concept became known as "Sinner's Circle" (Figure 1). This was most likely to help promote the use of a detergent to reduce time, temperature, and/or agitation in cleaning. However, this is a not a valid assertion, as adjustments in one of the factors do not allow for a proportional change in one of the other factors. Sinner’s article was published in the German trade journal Haus und Heim (House and Home) and was concerning household laundry, so this may have just been an oversimplification for the market Sinner was addressing.
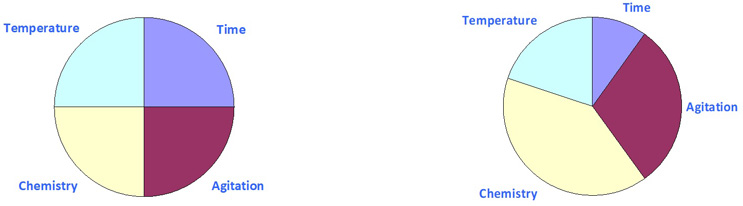
Figure 1: Sinner's Circle. Two examples of Sinner’s Circles (Example A and Example B). In Example B, increases in temperature, agitation, and chemistry allow a proportional decrease in time.
Despite this household laundry origin, these variables have become widely known today in the pharmaceutical industry by the acronym TACT and this term has been promoted at industry conferences by many presenters, most commonly by cleaning agent vendors. There are some cleaning agent vendors promoting an expansion of this acronym by adding four more variables, such as: TACT-WINS. The additional variables in WINS are:
- Water
- Individual (operators)
- Nature of the soil (e.g., product cleanability)
- Surface (material of construction and finish)
These cleaning agent vendors believe that these additional variables also play an important role in the cleaning process. The question is whether they play a critical role. We have already seen that the cleanability of products plays a very significant role.6 While it may seem difficult to determine the answer to this question for each of these factors, there are statistical tools available that can help. Before discussing how to identify critical cleaning process parameters in a cleaning process it is first important to understand what a process is.
A (cleaning) process can be simplified to:
- a set of inputs to the cleaning process,
- the cleaning process itself, and
- a set of outputs of the cleaning process.
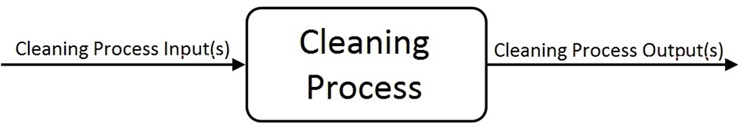
Figure 2: A Simple Model for a Cleaning Process
In Figure 2 we see a simple model showing that every process has inputs and outputs. In Figure 3 we see the model inputs represented by the well-known 6Ms from Six Sigma/ICH Q9 showing that each of these inputs have their own inherent variability and that the variability of the inputs affects the variability of the outputs.
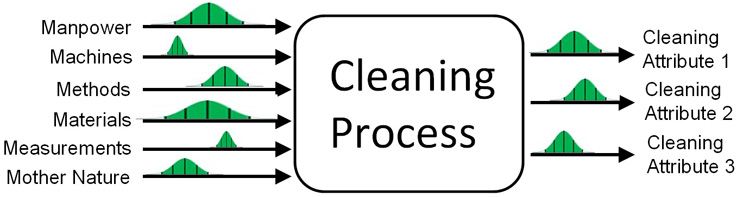
Figure 3: 6M Approach to Identifying Cleaning Process Inputs
Once the cleaning process and its subprocesses are understood from a 6M approach, their inputs and outputs can be further analyzed using an Ishikawa diagram as shown in Figure 4.
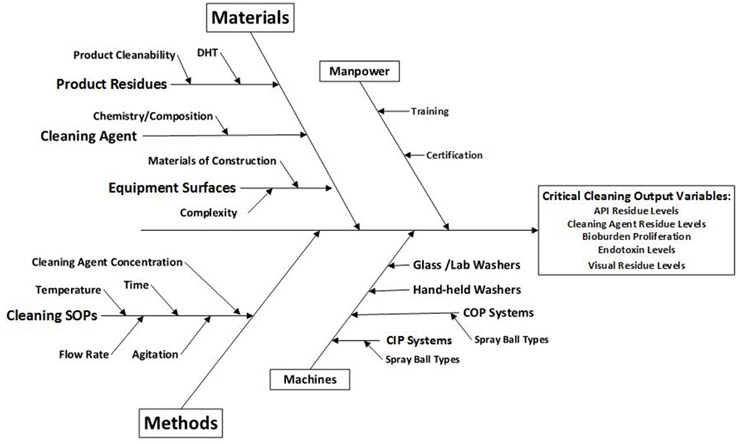
Figure 4: Example of a Cleaning Ishikawa Diagram. This diagram is an example; the inputs shown are not totally inclusive and many more inputs may be identified.
As can be seen in Figure 4, there may be many more factors involved in a pharmaceutical cleaning process than the four factors of Sinner's Circle or even the eight factors in TACT-WINS. But how many, and which ones, are critical factors? The answer to this can be obtained through application of the design of experiments (DoE) concept.
Each of the identified inputs from an Ishikawa analysis can be assigned as factors in a DoE and the effects of varying these factors can be measured by the changes seen in the outputs. From such experiments, knowledge and understanding can be obtained of the effects of each factor, including any interactions among the factors and the contribution of each factor to cleaning performance. Such knowledge and understanding can help achieve the desired cleaning objective, which is primarily to minimize residues left on equipment or devices, which in turn provides increased safety to patients.
Design Of Experiments (DoE)
The initial concepts of design of experiments were developed by Dr. Ronald Fisher at the Rothamsted Experimental Station over 100 years ago. While Fisher's experiments examined the effects of fertilizers on crop growth, such experiments can be easily used to examine the effects of cleaning input parameters on cleaning output variables and provide detailed knowledge and understanding about a cleaning process.
A full factorial DoE examines every possible combination of the factors tested and from the results can determine which ones are critical and which ones are not. A full factorial DoE can also determine whether there are any important interactions between the factors. Today there are many good resources available for learning about DoEs and how to use them.10
However, the number of runs required for a full factorial DoE is dependent on the number of factors studied and the number of levels for each factor (at least two) and this can become quite complex. For the eight factors discussed above, at two levels each, a full factorial DoE would require 256 experiments (28). Very few, if any, pharmaceutical companies would be willing to invest the time and resources into performing such a massive study for a cleaning process (or for many other processes, either). Fortunately, there are several DoE designs that can be used to evaluate a large number of factors while using a fraction of the number of runs of the full factorial design. Such fractional factorial designs can significantly reduce the number of runs, but these designs can result in confounding issues where main effects may be confused with interactions. It would be very helpful to know which factors are truly not critical and can be ignored.
Definitive Screening Designs
Most recently, award-winning definitive screening designs were developed by Jones and Nachtsheim11 that can evaluate and screen out many factors with a minimum number of runs (2n+1, where n is the number of factors that might be critical) while avoiding confounding issues between main effects and interactions. So, for eight factors, the total number of runs needed is now only 17. This is a very reasonable number of runs to perform. Such screening studies can be conducted first at bench scale using easy to perform tests. ASTM G122 evaluates the cleaning of residues and generates a unique cleaning effectiveness factor (CEF) for each residue evaluated.
Definitive Screening Of TACT-WINS Parameters
A definitive screening design was performed using TACT-WINS as parameters on two different topical creams with different CEFs. The results were analyzed in Minitab 18, and the main effects indicated that the only significant factors out of the eight were temperature and the products (i.e., product cleanability). Figure 5 shows the main effects plot of the definite screening design using the eight factors of TACT-WINS.
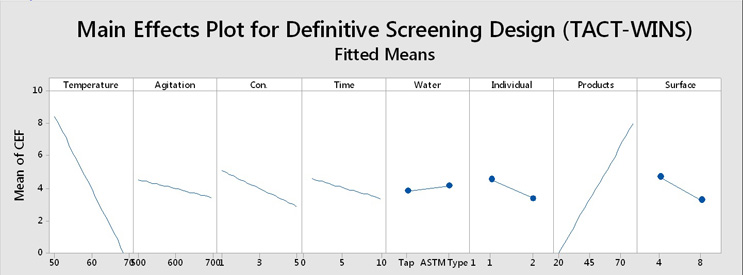
Figure 5: Definitive Screening Design Using TACT-WINS as Parameters. Temperatures were 50°C to 70°C, agitation was 500 RPM to 700 RPM, cleaning agent concentration was 1% to 5%, time was 1 minute to 10 minutes, water used was tap water and ASTM Type 1, individuals were two different Center for Pharmaceutical Cleaning Innovation (CPCI™) employees, products were two topical creams (one harder to clean and one easier to clean), and surfaces were 316L stainless steel/#4 finish and 316L stainless steel/#8 finish. Note: CEF = cleaning effectiveness factor.
While it seems clear that there is an effect from temperature and the cleanability of the products, it also appears that there might be some effects from the other factors. A Pareto analysis was performed on these results, which showed that the only statistically significant factors were temperature and product cleanability (A and G). In essence, how hard the product is to clean and what temperature (energy) is required to remove it are the main factors in this cleaning evaluation. The other six factors have much less — essentially insignificant — impact on the cleaning process. These results clearly demonstrate that it is important to accurately identify the product(s) that are hard to clean. Selecting parameters for cleaning validation studies using factors that are not truly important can result in "validating" a cleaning process that is actually inadequate.6
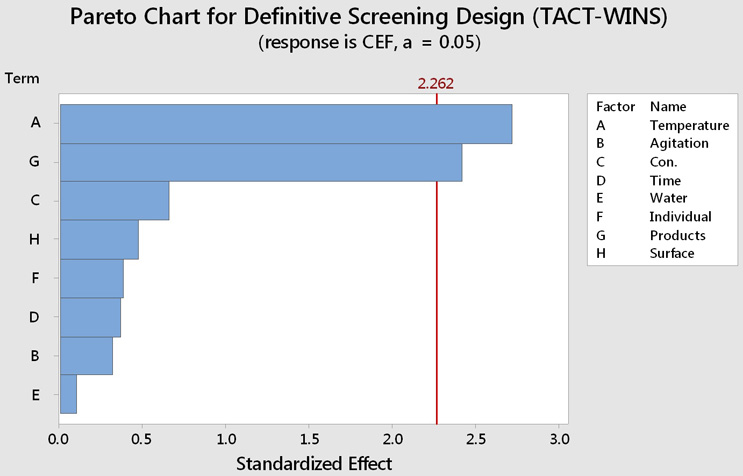
Figure 6: Pareto Analysis of DSD Using TACT-WINS as Parameters. The Pareto chart visualizes the absolute values and magnitudes of the effects from the largest effect to the smallest. In this graph, bars for the factors that cross the reference line (2.262) are statistically significant (α = statistical significance level = 0.05).
Readers may be surprised to see that cleaning agent concentration may not play a critical role in the cleaning of pharmaceutical manufacturing equipment. Multiple studies at the Center for Pharmaceutical Cleaning Innovation (CPCI)™ have shown that many pharmaceutical/biopharmaceutical products can be cleaned successfully simply using water at temperatures ≥ 70°C without any cleaning agents. Companies should not assume that cleaning agents are necessary just because they have been used in the past. Otherwise, cleaning procedures may be implemented that incur extra costs from using unnecessary cleaning agents and also may pose additional safety risks to patients from potential exposure to cleaning agent residues.
However, it should also not be assumed that the cleaning of all pharmaceutical products can be simply done by using hot water. In some cases, cleaning agents are necessary (e.g., cosmetics) or the product may become adhered to the surface at high temperatures and cleaning initially with cold water may be superior. Figure 7 shows an example where increasing the temperature has the opposite effect (i.e., residue levels are increased). Ultimately, cleanability studies at bench scale are necessary before making any decisions on setting any cleaning process steps and their parameters – temperature, cleaning agent concentration, or other parameters.
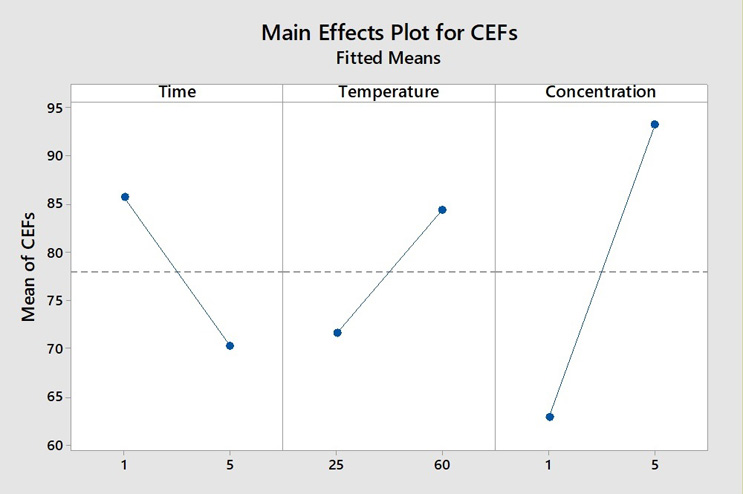
Figure 7: Main Effects Plot of CEF for an Albumin-based Product. In this study, increasing the temperature had a negative effect on cleaning performance, resulting in higher residue results at 60°C than at 25°C. Note also that an increase in cleaning agent concentration from 1% to 5% did not decrease residue levels and actually lead to an increase.
After evaluating the screening design, additional experiments may be performed at a small scale looking at a reduced set of factors to optimize the cleaning process using full (or fractional) factorial studies. A full or fractional factorial design can also be followed by a response surface design (e.g., central composite design) to explore the response surface. The response surface is a two- or three-dimensional plot of factors that can be useful in defining the cleaning design space. Based on these small-scale studies, the initial settings of critical parameters can be quickly selected for full-scale studies. The full-scale studies can then optimize the cleaning cycle using the knowledge and understanding obtained from the full or fractional factorial studies.
Question 5: What Are The Optimal Cleaning Parameter Settings?
Figure 8 shows a simple small-scale system used for modeling clean-in-place (CIP) cleaning processes.
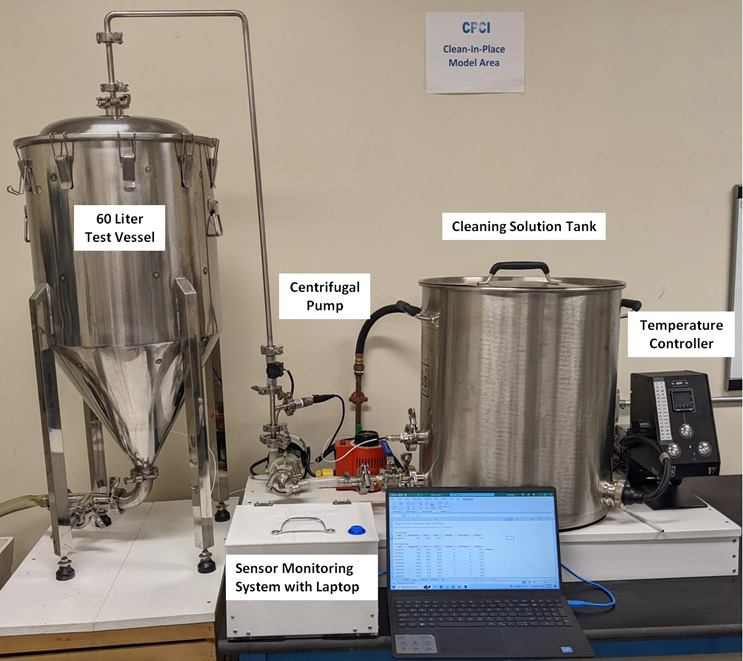
Figure 8: CPCI™-Developed Model Manufacturing Kettle and CIP System. This system is equipped with temperature, pressure, and flow rate sensors connected to a monitoring system.
The system is made up of a 60-liter test vessel with a rotating spray ball installed in the tank dome. The spray ball is fed cleaning solutions from a temperature-controlled cleaning solution tank through a centrifugal pump. The 60-liter test vessel has 18 stainless steel rods installed in six locations around the tank wall circumference and at three vertical positions (top, middle, and bottom), where test coupons can be suspended and exposed to cleaning solutions being tested (Figure 9). This 60-liter test vessel with CIP system can be used to easily run design of experiments in a few hours.
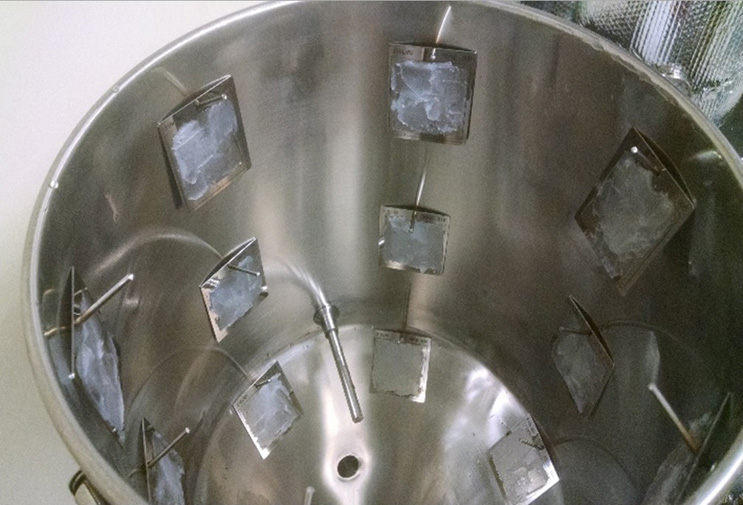
Figure 9: Interior of Model Manufacturing Kettle Showing Test Coupons Installed in the Top, Middle, and Bottom Locations.
The hardest-to-clean product (highest CEF) from the definitive screening design was spiked onto test coupons (316L stainless steel/#4 finish) following G121.4 The test coupons were then suspended in the test vessel in triplicate at the top, middle, and bottom locations (see Figure 9). (Note: this configuration allows up to six products to be tested in triplicate at the same time.) The test coupons were exposed for specified times (1 to 10 minutes), temperatures (25 to 60°C), and cleaning agent concentrations (0% to 1%) and then removed and the product residues remaining were determined following G122.3
After running the DoE, the response or output data (CEFs) of the design were then analyzed in Minitab. Minitab takes the input settings for all three factors and analyzes them against the CEFs found at each experimental setting. This analysis yields what is called a transfer function that identifies a coefficient for each factor and for each interaction of the factors (Fig 10).
![]()
Figure 10: Analysis of the DoE Yields a Transfer Function.
This transfer function can be used to predict what the output (residue level) will be for any combination of factors. Note that the transfer function determines coefficients for each parameter and their interactions, and these may be very different from each other and not simply proportional to each other as proposed in Sinner’s Circle.
Minitab can generate several types of graphs to help us understand the effects of the input variables.
The main effects plot examines whether different levels of a factor affect the response differently. The main effects plot (Fig. 11) graphs the mean for each factor level (high and low) connected by a line. These are calculated as the mean for each factor at the high levels minus the mean of each factor at the low levels. The greater the difference, the larger the effect and the steeper the slope of the line will be. If there is no difference between the levels, this line will be horizontal.
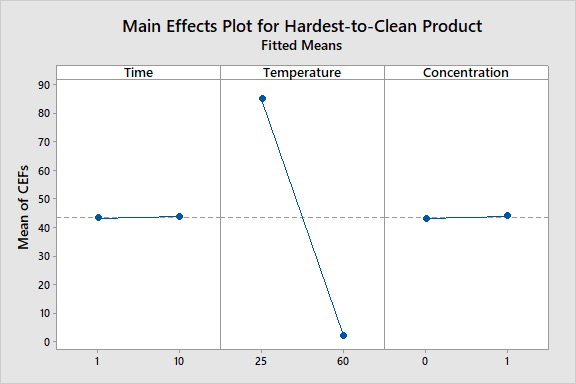
Figure 11: Main Effects of Cleaning Process Parameters. Here, we see that an increase in temperature from 25°C to 60°C had a very large negative effect (large reduction of residues) on the CEF; an increase in time from 1 minute to 10 minutes had no effect, indicating equivalent cleaning at both 1 and 10 minutes, so the additional 9 minutes were unnecessary; and an increase in concentration from 0% to 1% (aqueous solution) had only a very slight effect, indicating that this cleaning agent is not much more effective than just water.
The interaction plot (Fig. 12) shows whether the response of one factor is affected by the level of another factor.
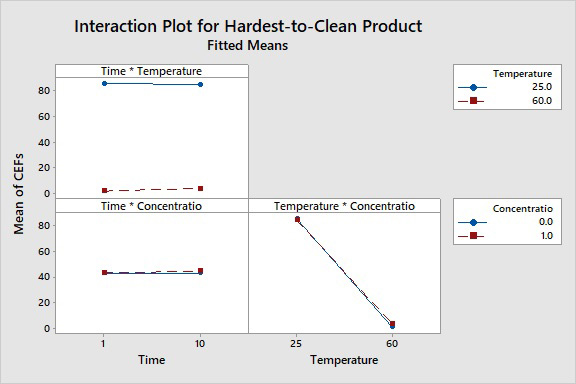
Figure 12: Interaction Plot of Cleaning Process Parameters. This shows whether the CEFs of each factor depend on another factor. These are calculated from the results for the high and low interactions. Lines that are parallel to each other show no interaction, such as we see with all three factors.
The Pareto chart also shows the absolute values of the standardized effects from the largest effect to the smallest effect (Fig. 13). This chart plots a reference line to indicate which effects are statistically significant. Bars that cross the reference line are statistically significant. The reference line for statistical significance depends on the significance level denoted by α or alpha (shown as α in the subtitle above). The Pareto chart is well understood in the business community and is a good first choice for presenting DoE results to management.
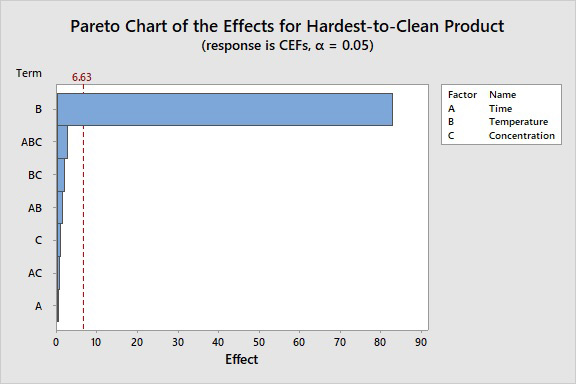
Figure 13: Pareto Chart of Effects. The bar that represents factor B exceeds the reference line at 6.63. This factor is statistically significant at the 0.05 level with the model terms from the analysis. The length of the bar for temperature crossing the reference line also indicates a very high level of significance. Note again that C (cleaning agent concentration) had no statistically significant effect and is not near the reference line.
These main effects, interactions, and Pareto plots provide clear and actionable information about which input factors and interactions are significant.
Summary
DoE is a very powerful and efficient tool to assess the significance of cleaning parameters and their interactions and can help optimize cleaning parameters during cleaning process development.
The cleaning process knowledge gained from the DoE can:
- provide valuable information on the cleaning process from a minimal number of experiments,
- provide valuable information about the need for cleaning agents (Note: CPCI™ has found that many pharmaceutical/biopharmaceutical products can be easily cleaned with water alone at temperatures > 70°C),
- identify critical cleaning input parameters and their acceptable ranges,
- provide an understanding of the main effects of critical cleaning input parameters and their interactions,
- reduce development time and costs,
- develop an efficient, consistent, and cost-effective cleaning process that can be used to support the validation of the cleaning process through the development of a cleaning design space, and
- justify the use of product or equipment grouping strategies.
A simple and recommended workflow to effectively use DoE is shown below:
- Determine the cleanability of all products to identify the hardest to clean.6
- Perform an Ishikawa analysis of parameters potentially affecting the cleaning process.
- Perform a definitive screening design of the hardest-to-clean product to identify critical factors from the Ishikawa analysis.
- Use DoE of the critical factors on the hardest-to-clean product to select parameter settings and optimize the cleaning process.
Peer Review
The authors wish to thank Alfredo Canhoto, Ph.D., Gabriela Cruz, Ph.D., Mallory DeGennaro, Parth Desai, Jayen Diyora, Andreas Flueckiger, M.D., Angela Garey, Christophe Gamblin, Ioanna-Maria Gerostathi, Ioana Gheorghiev, M.D., Jessica Graham, Ph.D., Hongyang Li, Ovais Mohammad, Mariann Neverovich, Miquel Romero Obon, Ajay Kumar Raghuwanshi, Siegfried Schmitt Ph.D., Osamu Shirokizawa, Lisa Wiesner, Joel Young and Ersa Yuliza for reviewing this article and for providing insightful comments and helpful suggestions.
References
- ASTM E3106-18 “Standard Guide for Science-Based and Risk-Based Cleaning Process Development and Validation” https://www.astm.org/e3106-22.html
- Big Pharma’s Little Secret: Drug Cross-Contamination Is Rampant https://www.bloomberg.com/news/articles/2021-07-26/big-pharma-s-little-secret-drug-cross-contamination-is-rampant?
- ASTM G122 "Standard Test Method for Evaluating the Effectiveness of Cleaning Agents and Processes.” https://www.astm.org/g0122-20.html
- ASTM G121 “Standard Practice for Preparation of Contaminated Test Coupons for the Evaluation of Cleaning Agents.” https://www.astm.org/g0121-18.html
- Walsh, Andrew and Ruijin Song, "ASTM Standards For Cleanability Testing Of Pharmaceuticals And MedicalDevices“ Pharmaceutical Online September 2020
- Song, Ruijin, Alfredo Canhoto, Ph.D., and Andrew Walsh, "Cleaning Process Development: Cleanability Testing and "Hardest-To-Clean" Pharmaceutical Products" Pharmaceutical Online January 2019.
- Song, Ruijin and Andrew Walsh, "Cleaning Process Development: Selection of Cleaning Agents," Pharmaceutical Online, November 2020
- Song, Ruijin and Andrew Walsh, "Cleaning Process Development: Time To Clean Studies & The Cleaning Assurance Level For Pharmaceutical Product," Pharmaceutical Online, December 2020
- Sinner, Dr. Herbert, “Über das Waschen mit Haushaltswaschmaschinen,” Haus & Heim, 1959.
- Montgomery, Douglas, "Design and Analysis of Experiments" Wiley; 9th edition (March 13, 2017)
- Jones, Bradley & Christopher J. Nachtsheim "A Class of Three-Level Designs for Definitive Screening in the Presence of Second-Order Effects" Journal of Quality Technology Volume 43, 2011 - Issue 1