
Do The Arguments For Pharmaceutical Price Increases Make Sense?
By Edric Engert, managing director, Abraxeolus Consulting

Here in the U.S., we are incredibly fortunate regarding the improvements in healthcare over the ages. Through our continually increasing understanding of disease, life-saving surgical procedures, improvements in older procedures, new pharmaceutical and medical device therapies, and holistic approaches to health, we have seen a continuous increase in both longevity and quality of life. So much of this can be captured in one potent word – innovation. Stimulating innovation, of course, leads to such things as value creation but also the continuance of significant advances in healthcare, its outcomes, and, hence, life.
Unfortunately, the ever-increasing healthcare expenditures in the U.S., both in aggregate as well as the hardships they cause for individual patients and their families, have caused many to ask the fundamental question: Is the current model economically sustainable? And if changes are needed and made, how do we ensure that innovation is not stifled in any way?
In the first of what will be a multipart article, I’ll share a recent analysis I did of price increases within the healthcare sector in an effort to understand the growth of healthcare expenditures and pharmaceutical prices over time.
Examining Healthcare Expenditures: A Brief Look At The Economics
We can begin by looking at healthcare expenditures as a percentage of Gross Domestic Product (GDP). In 1970, healthcare was only 7 percent of GDP, but by 2019 it had risen to 18 percent. This was driven by the fact that healthcare grew at a rate that was often more than 3 percentage points beyond the total economy’s growth rate. Thankfully, the two growth rates of overall economy and healthcare are starting to converge a bit, but healthcare is still outpacing the overall economy (healthsystemtracker.org).
Many might assume this is related to the growing complexity of care, but this is not the case. Even simple outpatient office visits have gone from $60 a visit in 2003 to $100 in 2016, while the GDP deflator only rose to $78 in the same period. (Note: The GDP deflator is used to illustrate and quantify the differences between overall inflation in the economy vs. inflation in a specific sector, in this case, healthcare. In this last example, outpatient visit prices went up nearly 67 percent [from $60 to $100], whereas the overall economy saw price increases of only 30 percent over the same period.) Such outpatient visits increased irrespective of level of severity, with simple cases increasing 85 percent compared to general economic inflation of only 28 percent. The cost of most severe visits went up 52 percent, and those in the middle of the severity range increased 54 percent (healthsystemtracker.org).
Of course, other areas increased as well. A laparoscopic appendectomy, for example, climbed from $8,000 to $20,000, whereas the GDP deflator went from $8,000 to $10,000. The average price of a knee replacement went from about $19,000 to almost $35,000, whereas the GDP deflator only rose to $24,000 (healthsystemtracker.org).
My personal experiences in healthcare only further support such concerns. Why does an oncologist stop in to ask my dad how he’s doing and how his breathing is – nothing else – and yet charge $400 for the visit? Why would a 30-day supply of solid oral tablets that I know are generic cost $72 at a large pharmacy chain when their acquisition cost is likely less than $5? (Thankfully, I shopped for a better pharmacy and found a much better deal.)
And finally, how could a femur, that broke off in the hip joint, be repaired for $12,900 (which included a 2 week stay plus room service in a hospital in the Grunewald of Berlin, Germany), whereas a 2-minute outpatient surgical procedure for my son here in the U.S., including the surgery itself, the anesthesia, and the brief recovery afterward, cost $15,500? What pharmaceutical companies charge wholesalers, hospitals, and retail pharmacies is not the only problem we have in this country’s healthcare system. That much is obvious to me.
At the same time, however, we should not be rushing to simple solutions. All the examples above do not imply overwhelming returns for hospitals and physicians across the board. Some physicians, for example, can be paying up to 60 percent of their revenue just for medical malpractice insurance. Overwhelming waste, perhaps, but not necessarily overwhelming returns.
Is High-Risk Development An Adequate Argument For High Pharma Prices?
In spite of all of this, pharma should not be ignored. From 2008 to 2016, the average price per unit of a branded injectable drug went up on average 15.1 percent per year. Even solid oral went up 9.2 percent a year over the same period (Pharmacy Times, March 2019). This partially contributed to a spike in total pharma spending in the U.S. of 8.1 percent in 2015 and 11.5 percent in 2014 (healthsysystemstracker.org).
Pharma also represents a considerable portion of total healthcare expenditures. In 2018, pharma made up 16.8 percent of total healthcare costs, with almost 75 percent of this at retail pharmacies, and the rest dispensed by healthcare professionals, such as those at hospitals and clinics (politifact.com, 2/22/19).
Now, some try to divert our attention from branded and specialty drugs by focusing on the generics industry. But the simple fact is that “prices for common generic drugs have dropped by 37 percent since 2014, while branded drug prices have increased by over 60 percent” (healthsystemstracker.org)
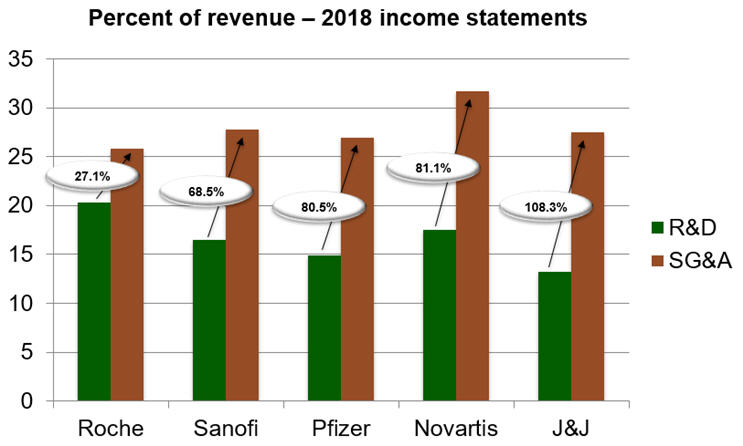
Still others say we need high prices to fund research and continue to drive innovation. However, R&D budgets often include business development budgets for in-licensing of products from other companies. And it’s incredibly rare to see R&D as the largest cost item on an income statement of a pharmaceutical firm, at least not one that is also responsible for the commercialization of the products.
For example, if we take a look at the top five pharmaceutical firms based on size of revenue and review their income statements for 2018, we see that Roche, Sanofi, Pfizer, Novartis, and J&J spent 27.1 percent, 68.5 percent, 80.5 percent, 81.1 percent, and 108.3 percent more, respectively, on SG&A (Sales, General, and Administrative) than R&D.
Some say we face such high prices because pharma development is so risky. But how to measure risk? And just as importantly, how can one measure the success of a company that is operating in a risky environment?
For the latter, we can use a standard financial metric called return on equity, or ROE. ROE is simply the ratio of net income to equity. However, we need to be careful here. Both the numerator and the denominator of this ratio come from a company’s financial statements. In other words, we take the net income from the income statement or P&L and the equity from the balance sheet.
What’s important to note here is that we are not taking market cap as equity but rather “book equity,” i.e., the equity as stated in the financial statements and not what the securities markets determine as the market price and capitalization of the firm. The simplest way to think about book equity is to think of all the assets a company has. It could be cash, accounts receivable, property, plant, and equipment (PPE), and a host of other components. When you ask how the company amassed these assets, the answer is either through liabilities or equity. Liabilities are just debts, through various financial instruments. Equity, on the other hand, could be from paid-in capital or the accumulation of retained earnings.
Keep in mind that paid-in capital could be from the founders of a firm when a company was first created, and it can also be from common and preferred stock issuance throughout the life of the firm. Retained earnings, on the other hand, are the profits that were kept and reinvested in the firm’s operations and not distributed as dividends to the shareholders. Book equity is therefore simply assets minus liabilities and the root of why ROE is such a telling metric of a company’s performance. It allows us to see the ratio of profits, or earnings, to the shareholders’ equity in the firm, i.e., what was paid in at inception and over time by shareholders and what was retained in profits to further fund the operations and growth of a firm. In summary, how effectively and efficiently is the management converting paid-in capital and past profits into more profits? The answer can be found in ROE.
Now let us turn to industries and companies. Some industries can have incredibly high ROEs. Imagine a firm that requires little in terms of assets, e.g., PPE. If it needs little in assets, there is very little it needs in the sum of liabilities and equity. Any profits then generate a rather high ROE, since the denominator in the metric is so low. Illustrative industries would be accounting and legal services. Accounting has an industry average ROE of over 70 percent and legal services over 80 percent, with leaders in each cohort of course achieving much more (Forbes).
When analyzing pharmaceutical firm performance, it’s therefore important to look only at industries and companies that have significant investments in PPE. Companies that are focused on product launches with both technical and market risks should be included to ensure we are to the best of our ability making an “apples to apples” comparison. The first that comes to mind is General Electric. GE has been a successful and well-managed company over time. Its ROE in recent years has not exceeded 11 percent, however, and in many instances was significantly below this ratio (Macrotrends).
There are other companies, for example in the automotive industry, that have done better. Ford and BMW are examples of firms with high operational leverage as well as both technical and market-based risks as they try to compete in their launching of new products. Ford has recently enjoyed ROE of between 6 and 22 percent. BMW has enjoyed ROE of 7 to 16 percent (Macrotrends).
How has the pharmaceutical industry fared? Let’s focus on two companies for illustration, one with a very broad portfolio of products resulting in great innovation over time and one whose success is more focused on just one product and through business development, not research. The former is Novartis, which in recent months enjoyed a 28.1 percent ROE. The latter is AbbVie, whose ROE was 116 percent in March 2017, 215.65 percent in June 2018, and 1,285.47 percent by end of September 2018.
Seeing such numbers compared to other businesses in industries that face risk and are operationally leveraged with high PPE, especially in the case of AbbVie, makes us wonder how one can credibly say that the high prices of drugs are needed to cover the risks of the business and ensure economically sustainable innovation.
And as if such simple financial metrics aren’t already enough to uncover the mistruths about the need for high prices, risk in the pharmaceutical industry from an R&D perspective has actually been going down over the years. The probability of success (PoS) of a novel biologic, for example, is over twice as high as the PoS for a small molecule. In summary, the argument that high prices are needed to support the risk of drug development is: 1) directly in contradiction with the facts, and 2) further waning with the increasing PoS of R&D.
Hence, pharmaceutical pricing in the U.S., while certainly not the only challenge we are facing in healthcare today, absolutely cannot be ignored, with none of the counter arguments holding water—not a drop.
About The Author:
 Edric Engert is managing director of Abraxeolus Consulting and has over 20 years of experience in the healthcare industry. He offers problem solving leadership and expertise in such areas as strategy and its operationalization; business development/in-licensing; portfolio strategy, selection, and management; operational improvement programs and turnarounds; and M&A. He has advised clients in such industries as biosimilars, generics, branded pharmaceuticals, API, healthcare information exchanges, medical supply, distributors, trade associations, and not-for-profit agencies. Prior roles included head of the biosimilars business at Teva, global head of portfolio management and in-licensing for Teva’s generics business, and global head of portfolio management and in-licensing at Sandoz, among others. Engert holds an MBA from Wharton and a BS in Mathematics from MIT.