
Risk-Based Analytical Method Selection In Cleaning Validation Using ASTM International Standards
By Andrew Walsh; Thomas Altmann; Joshua Anthes; Ralph Basile; Alfredo Canhoto, Ph.D.; Stéphane Cousin; Hyrum Davis; Parth Desai; Boopathy Dhanapal, Ph.D.; Jayen Diyora; Igor Gorsky; Benjamin Grosjean; Richard Hall Hall; Solenn Janvier, Ph.D.; Ovais Mohammad; Mariann Neverovitch; Jeffrey Rufner; Siegfried Schmitt, Ph.D.; Osamu Shirokizawa; Steven Shull; Stephen Spiegelberg, Ph.D.; and John VanBerschot

Part of the Cleaning Validation For The 21st Century series
The life sciences industry began the movement to science-, risk-, and statistics-based approaches to cleaning process development and validation with the publication of the ASTM E3106 Standard1 in 2017. In ASTM E3106 it states that the selection of analytical methods for use in cleaning validation “should be science and risk based,” and that “The goal should be to use a method that is fit for use and can be justified.” Figure 1 shows a hierarchy of possible analytical methods for cleaning validation based on the level of risk. This article will focus on the selection of chemical methods; the selection of microbiological methods is outside the scope of this discussion.
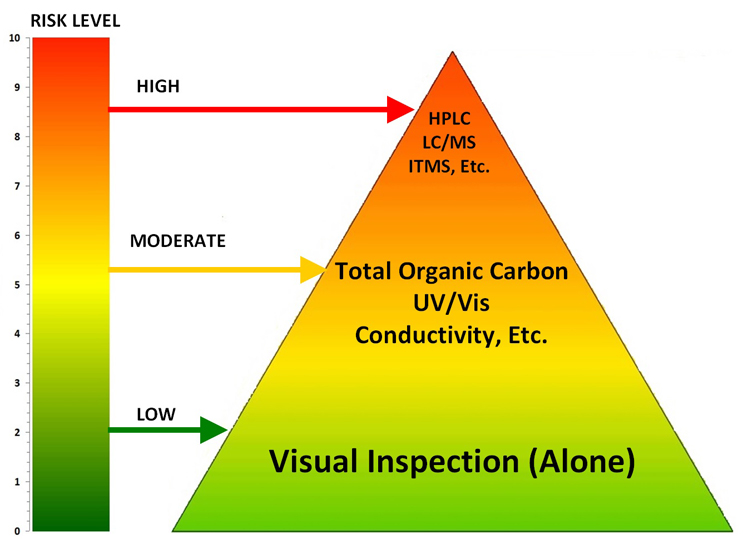
Figure 1: Hierarchy of Analytical Methods Based on the Level of Risk – At the lowest levels of risk, visual inspection alone may be justified as a sole analytical method. As the level of risk increases, visual inspection (required as GMP) may need to be supplemented by nonspecific methods. Finally, at the highest levels, specific methods may be necessary.
Note: Risk in this article is defined as a function of toxicity of process residues, exposure to process residues, and detectability of process residues.1
While Figure 1 may seem logical and sensible, it invokes two questions:
- How do I determine the level of risk?
- How do I select methods based on the level of risk (that is, how to move from Low to Moderate or Moderate to High)?
This article will explain how both of these questions can be answered and with scientific justification.
How Do I Determine The Level of Risk In Cleaning Validation?
ASTM E3106 describes how risk in cleaning exists on a continuum (Figure 2) based on the toxicity of a compound residue, the probability of patient exposure to the residue, and the detectability of the compound residue. Factors contributing to the level of risk include the hazard level (toxicity) of the compound (active pharmaceutical ingredient, cleaning agent, etc.), the effectiveness of cleaning as measured by its cleaning process capability, and the suitability of analytical methodologies for detecting compound residues on manufacturing surfaces or medical device surfaces.
While this concept is easy to understand, one difficulty has been how to select analytical methods based on where a compound or product would be on this continuum.
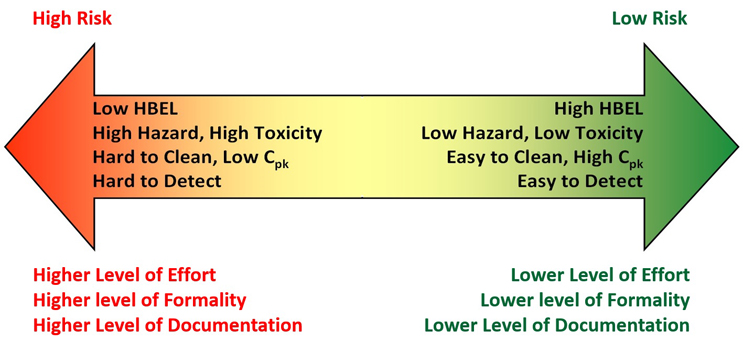
Figure 2: Continuum of Risk in Cleaning based on Hazard, Exposure, and Detectability – figure used with permission from Figure 1 in ASTM E3106.
The ASTM E3470 “Standard Guide for Using FMECA and HACCP for Performing Risk Identification, Risk Analysis & Risk Control on Cleaning Processes for Pharmaceuticals and Medical Devices"3 describes a science- and risk-based approach for selecting risk controls based on the compound’s toxicity and the process capability of its cleaning procedure. The toxicity and process capability are mapped on a Shirokizawa matrix to determine the level of criticality as shown in Figure 3, with toxicity scale on the X axis and Cpu score ((1/process capability) *10) on the Y axis.
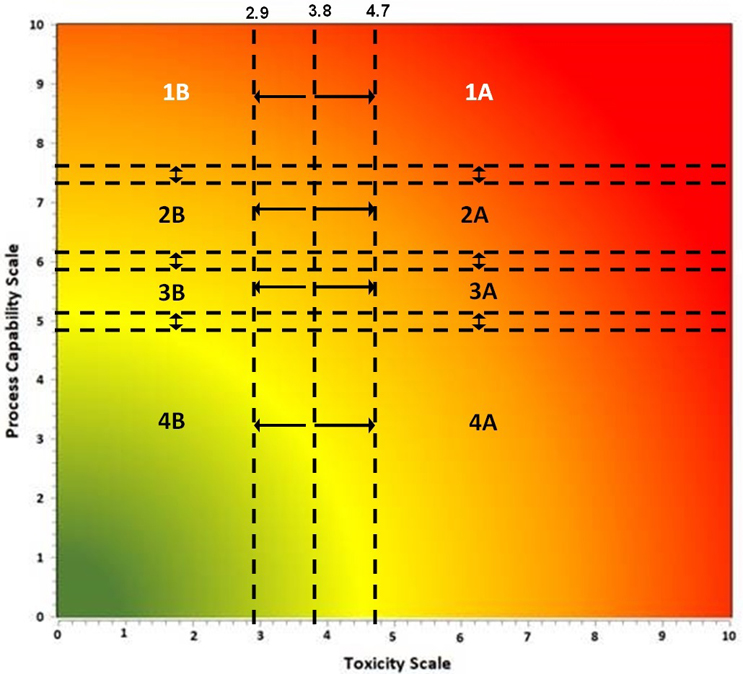
Figure 3: Shirokizawa Matrix for Method Selection – The Shirokizawa matrix is divided into eight categories (1A – 4B) based on the toxicity score of the compound and the Cpu score of the cleaning process.
Figure used with permission from Figure 4 in ASTM E3470.
In the Shirokizawa matrix in Figure 3, the toxicity scale value is derived from the health-based exposure limit (HBEL) of the compound, as described in ASTM E3219,4 and the process capability scale value from the Cpu is determined for the cleaning process. In cases where the Cpu has not been determined, such as for a new product, it can be estimated from known Cpu values for similar cleaning processes or from evaluation of historical data. Plotting these values on the Shirokizawa matrix will place your compound into one of eight categories as described in ASTM E3470. Each of these categories has recommended risk reduction activities and risk control activities, including the selection of analytical methodologies.
How do I select methods based on the level of risk?
From the Shirokizawa matrix in Figure 3 we can determine a criticality level for a compound based on its toxicity (HBEL) and its cleaning process capability (Cpu). ASTM E3470 recommends that methods should be considered (or required) based on the level of criticality (Table 1).
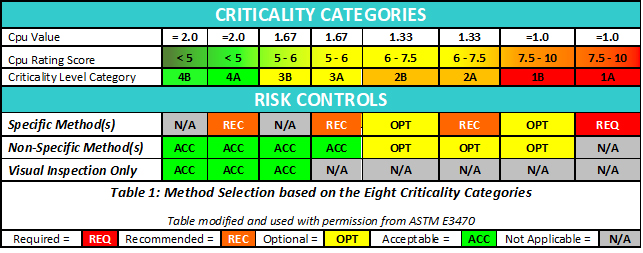
As shown in Table 1, the criticality impacts the need for method specificity. Specifically, as the criticality decreases the acceptability of nonspecific methods increases. At the lowest level of criticality, visual inspection alone is a potential method, as shown in Figure 1. Ultimately, the decision on the selection of the method should be based on the knowledge of the cleaning processes and the maturity level of quality risk management (e.g., as per ICH Q9) in the individual organization.
What About Detectability?
While this Shirokizawa matrix considers toxicity and process capability to determine criticality categories, it does not consider analytical method detectability or how detectability can be evaluated. However, the criticality category can be used to determine the analytical method performance that is required. This concept is recognized by FDA, which back in its 1993 guidance on cleaning validation5 wrote that:
Determine the specificity and sensitivity of the analytical method used to detect residuals or contaminants. With advances in analytical technology, residues from the manufacturing and cleaning processes can be detected at very low levels. If levels of contamination or residual are not detected, it does not mean that there is no residual contaminant present after cleaning. It only means that levels of contaminant greater than the sensitivity or detection limit of the analytical method are not present in the sample.
Obviously, FDA has considered detectability, or method performance, to be an important input for determining risk for quite some time. Processes with higher criticality categories require a higher level of specificity and sensitivity. Scales have been developed that can be used to determine the acceptability of an analytical method based on its sensitivity (i.e., detection limit).
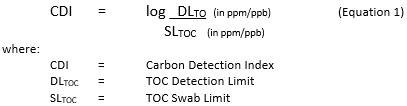
For example, a method detectability scale exists that can be used to determine at what criticality category total organic carbon (TOC) method performance is suitable.6 The scale is based on the logarithm of the ratio of the detection limit (DL) to the swab/rinse sample limit (Equation 1).
An example of this TOC detectability scale is shown in Figure 3.
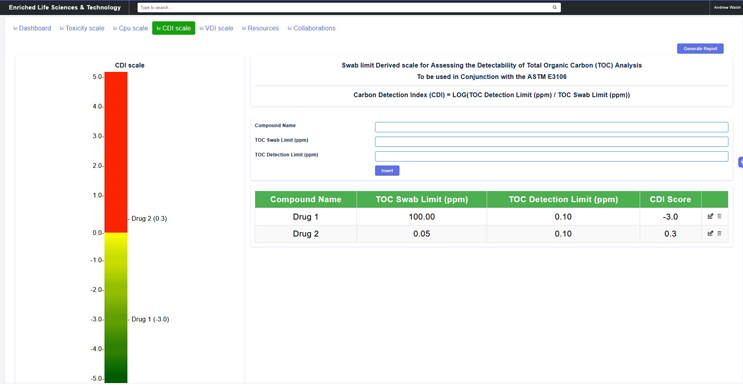
Figure 4: Carbon Detection Index (CDI) Scale – This graphic shows a detectability scale for TOC available through this website. In this display, the swab limits for Drug #1 (100 ppm) and Drug #2 (0.05 ppm) have been entered along with a TOC detection limit of 0.10 ppm (100 ppb). Drug #1 is in the green zone with a CDI ratio of -3.0, which is 1,000 times lower than the minimum ratio of 0.0. TOC is very appropriate as an analytical method for Drug #1. Drug #2 is in the red zone with a CDI ratio of 0.3, making TOC inappropriate as an analytical method for Drug #2.
Note: If an Index for Quantitation is desired instead, the CDI can be simply converted by substituting the DLTOC with the QLTOC in the calculation.
Similarly, a method detectability scale exists that can be used to determine at what criticality category visual inspection is suitable.7 This visual detection index (VDI) scale is based on the logarithm of the ratio of the visual residue limit (VRL) to the maximum safe surface residue (MSSR) limit (Equation 2).
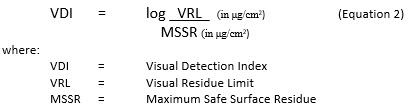
The MSSR is derived directly from the HBEL for the compound and the VRL is determined in the laboratory from spiking studies using coupons.
An example of this visual inspection detectability scale is shown in Figure 4.
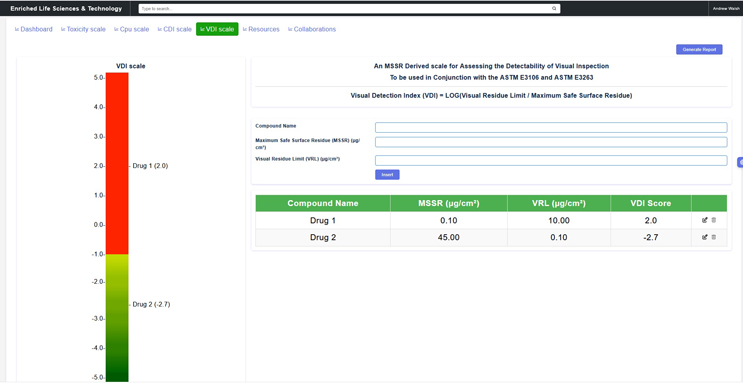
Figure 5: Visual Detection Index (VDI) Scale – This graphic shows a detectability scale for visual inspection available through this website. In this example display, MSSR limits for Drug #1 and Drug #2 are 0.1 μg/cm2 and 45 μg/cm2 respectively. Visual detection limits were determined and have been entered with a visual detection limit of 10 μg/cm2 for Drug 1 and 0.1 μg/cm2 for Drug 2. These values cover the range of values that have been reported in the literature (ASTM E3263).
Drug #1 is in the red zone with a VDI score of 2.0, making visual inspection inappropriate as an analytical method for Drug #1. Drug #2 is in the green zone with a VDI score of -2.7, which is lower than the minimum score of -1.0, making visual inspection acceptable as an analytical method for Drug #2.
Based on input from FDA, the E3263 Standard Practice Guide8 was revised to require that the log of the ratio be at least -1.0 (i.e., the DL is at least 10 times lower than the MSSR limit).
These scales can be easily adapted to any other analytical method. All that is necessary to use them is a detection limit (or quantitation limit) and a swab or rinse limit. Companies should decide what ratio is appropriate for other methods based on the criticality of the compound. For example, for a compound in category 2B, the ratio might be set to -1.0, whereas for a compound in category 4B, a ratio of 0.0 may be acceptable.
In order to use these scales, the swab or rinse sample limit, or the MSSR, must be known. ASTM E34189 provides comprehensive guidance on how to calculate all of these limits.10 Additionally, an online calculator has been developed following E3418 to determine these limits (Figure 4) and is free to use.11 The swab/rinse sample limits or MSSRs can be easily calculated and then used to determine the CDI or VDI scores.
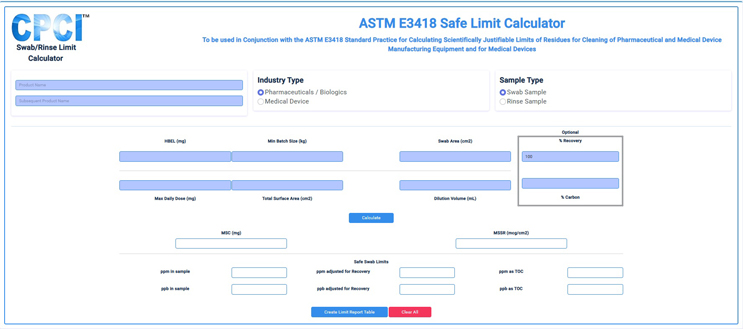
Figure 6: Online E3418 Safe Limit Calculator – This graphic shows an online calculator that can be used to determine safe swab/rinse limits and MSSRs through this website.
Once the category of acceptable methodologies has been identified and the detectability of that methodology verified, an appropriate analytical method can be selected. The methods typically used in each category are described below.
High (Risk) Criticality
At the highest level of risk (compounds found in categories 1A and 1B), specific methods may be necessary. The decision that specific methods are necessary should be made based on a close examination of the HBEL Monograph as discussed in ASTM E3470. It is important to understand that the HBEL Monograph is not just a number but is a risk assessment, and the cleaning validation subject matter experts/cleaning process owners should be aware of all the safety issues with each of the drugs in their facility and use this information to decide whether specific methods should be used. Examples of specific methods include:
- High performance liquid chromatography (HPLC) analysis
- Ultra-high performance liquid chromatography (UHPLC) analysis
- HPLC/mass spectroscopy
- Ion trap mobility spectrometry (ITMS)
- FTIR
- SDS PAGE
- PCR/rtPCR (e.g., for vaccines)
When it comes to specific methods, companies can choose from two main options:
- Option 1: Adapt an existing method (i.e., product release method) for each target residue.
- Option 2: Develop one specific method for all target residues.
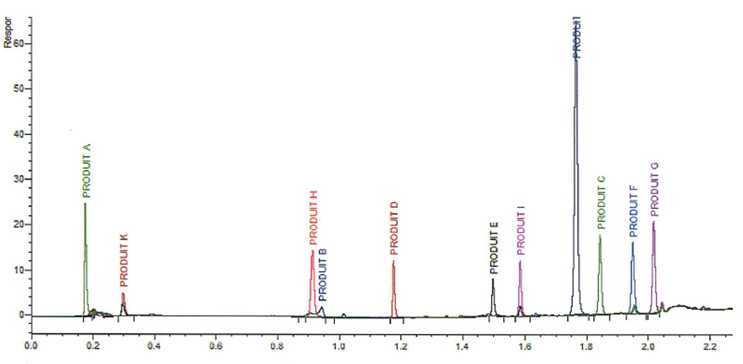
Figure 7: Over 300 compounds tested and 80% can be detected by this C18 method.
It is important to understand that the aim is not necessarily to obtain perfect separation between each analyte but to achieve satisfactory resolution and elution for each one and, thus, the necessary sensitivity. This system can obtain an acceptable chromatogram in around 3 minutes. With this method, it is therefore possible to carry out a complete analysis sequence in around 30 minutes, providing production areas with precise and reliable results very quickly for equipment release. Several studies can be analyzed on the same instrument using a single method, which does not limit the activities of the validation teams in charge of developing and validating cleaning procedures.
Moderate (Risk) Criticality
At the moderate level of risk (compounds found in categories 2A, 2B, and 3A), nonspecific methods are acceptable. Again, it is important that the cleaning validation subject matter experts/cleaning process owners are aware of all the safety issues with each of the drugs in their facility, and a review of the HBEL Monograph is an important activity and should be used to decide what nonspecific methods are appropriate. Examples of nonspecific methods include:
- Total organic carbon (TOC) analysis
- UV-Vis spectrometry
- Conductivity
- Test strips (e.g., for pH, chlorides, peroxides, etc.) “.
Several analytical methods may be combined into a suite of methods to provide a higher weight of evidence of successful cleaning performance. The combination of methods should depend on the level of risk determined.
An ASTM standard on using TOC for cleaning validation studies is in development as of this writing.12
Low (Risk) Criticality
At the lowest level of risk (compounds found in categories 3A, 4A, and 4B), visual inspection may be an acceptable analytical method by itself.
Visual inspection has been widely used for many years by the pharmaceutical, biologics, and medical device industries after cleaning to release manufacturing equipment and devices. Once properly qualified,13 visual inspection can be an effective method for releasing manufacturing equipment for further use, or commercial release of medical devices, that can provide greatly improved operational efficiency. Studies have been performed to demonstrate the accuracy, precision, linearity, and detection limits of visual inspection as an analytical method.14
The European Medicines Agency (EMA) issued a Q&A15 to its guideline on determining HBELs that describes what criteria have to be met for visual inspection to be acceptable to the EMA for release of manufacturing equipment. While the possibility of using visual inspection alone may be very attractive to manufacturers, its use must be justified as outlined in EMA Q&As #7 and #8 on HBELs. ASTM E32638,13 provides guidance on how to meet these criteria and demonstrate that operators/QA inspectors are capable and qualified to accurately assess the absence or presence of residues on manufacturing equipment or medical devices.
Discussion
In 1984, Samuel Harder published an article, The Validation of Cleaning Procedures, and discussed many aspects of what he saw would be required to validate a cleaning process.16 Most of the ideas he expressed can still be seen in practice in cleaning validation today. Concerning the setting of acceptance limits, Harder wrote that limits:
“.…must be practical and achievable by a reasonable cleaning procedure… must be verifiable by analytical methodology existing in the company… and must be safe and acceptable and in line with residual limits set for various substances in foods.”
The phrase “practical, achievable, and verifiable” (strangely missing “safe”) subsequently appeared in the FDA’s 1993 Guidance on Cleaning Validation18 and these three criteria rapidly began to appear in many other cleaning guidelines, cleaning validation literature, and pharmaceutical company cleaning validation policies and programs. It is unclear today why “safe” was dropped as this may be the most important criterion as pertaining to patient safety.19
The FDA’s 1993 Guidance also mentions “…analytical detection levels such as 10 PPM, biological activity levels such as 1/1,000 of the normal therapeutic dose, and organoleptic levels such as no visible residue” and references the well-known Fourman and Mullen article.19 Consequently, many companies, but not all, adopted these criteria for setting their acceptance limits for cleaning validation.
Over time, many companies began to find that they were not able to meet the 1/1,000th dose and 10 ppm criteria.20 In many cases, limits calculated from these criteria were too low to be verified or the cleaning procedures could not achieve them, and these criteria, by their own definition, became not practical. Worse, there was no guarantee of patient safety as the simple dose-based limits or the arbitrary 10 ppm did not consider all the important toxicological and pharmacological information about a compound such as teratogenicity, therapeutic index, sensitization, etc.20 These arbitrary and non-health-based limits were causing operational problems to the point that many companies began simply moving to less restrictive limits such as 1/100th of a dose or 1/10th of a dose21 or 100 ppm.
The publication of the ISPE Risk-MaPP Guide22 introduced the acceptable daily exposure (now known as the HBEL), providing a clearly scientifically justified approach for setting acceptance limits and mitigating these issues. The adoption of the HBEL is now a regulatory requirement while providing a science- and risk-based approach to analytical method selection.
An article published in 2016 calculated and compared the HBEL values and the 1/1,000th therapeutic dose for 304 pharmaceutical products (data provided by several pharmaceutical companies).23 Swab limits were calculated from these data and are plotted in Figure 5. The alternative 10 ppm limit also was calculated and plotted where it was less than the 1/1,000th dose limit.
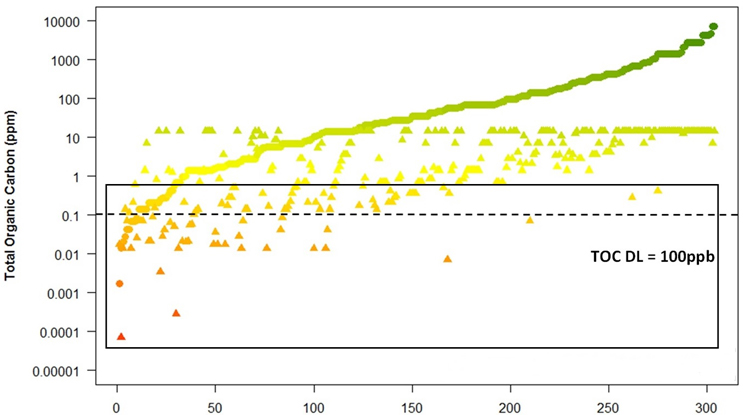
Figure 8: Comparison of swab limits for HBEL and the 1/1,000th and 10 ppm
A line has been added at the 100-ppb level (0.1 ppm) to use as a reference for a TOC detection limit. A rectangle has been drawn containing those compounds that are below or too close to the 100 ppb TOC detection limit. It can be seen that there are many compounds where TOC cannot be used with the 1/1,000th and 10 ppm limits.
▴ = 1/1000th or 10ppm (in the product)
● = HBEL
(Note: data had to be plotted on a log scale in order to visualize all data on one graph.) Graph courtesy of Ovais Mohammad
As shown in Figure 5, many of these compounds in the rectangle cannot be considered for evaluation by TOC as the swab limits based on the 1/1,000 or 10 ppm are below or too close to the TOC detection limit to be justified as a safe method of analysis. However, if only HBELs are used to calculate the swab limits, about 80% of these compounds could easily be considered for evaluation by TOC (Figure 6).
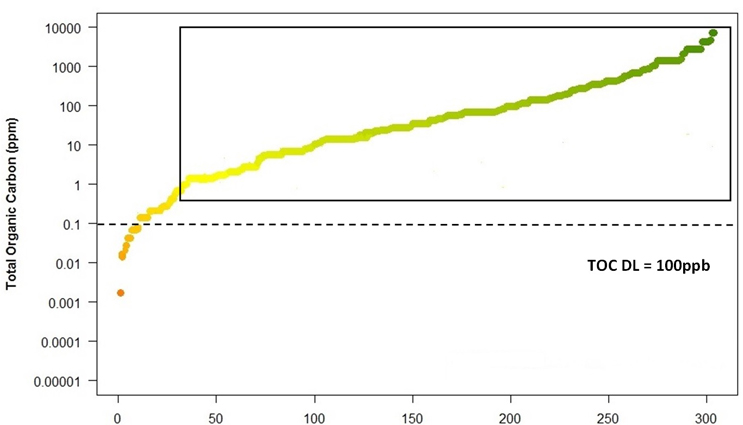
Figure 9: Compounds where TOC can be used when using HBEL limits
It is clear the compounds moving toward the right side of the curve (in the rectangle) could easily be justified for evaluation by TOC. But as we move to the left and the swab limits get closer and closer to the 100-ppb detection limit, it would be harder to justify using TOC. It is also important to lower the TOC detection limit as much as possible to allow for the analysis of more compounds.
A similar situation existed for using visual inspection (Figure 7).
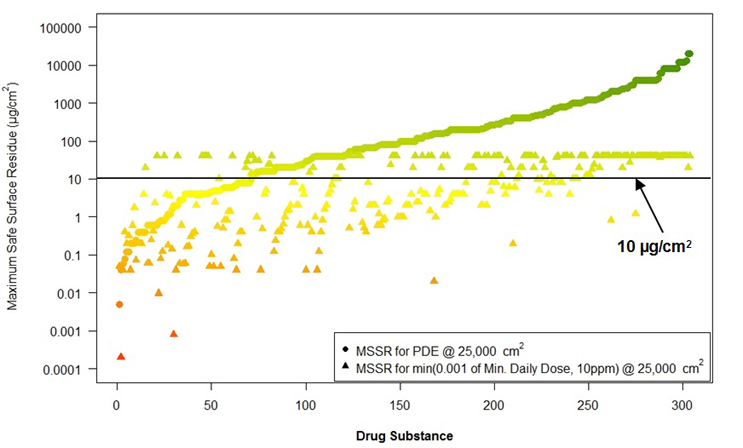
Figure 10: Comparison of MSSRs for HBELs and 1/1,000th and 10 ppm
A line has been added at the 10 μg/cm2 level to use as a reference for a visual detection limit. 10 μg/cm2 is the highest visual residue limit (VRL) reported in the literature24 (Forsythe ref). It can be seen that there are many compounds below the 10 μg/cm2 detection limit.
▴ = 1/1000th or 10 ppm (in the product)
● = HBEL
(Note: data had to be plotted on a log scale in order to visualize all data on one graph.) Graph courtesy of Ovais Mohammad
In Figure 7, a line has been drawn at the 10µg/cm2 level for the VRL. Obviously, many of these compounds could not be considered for evaluation by visual inspection as the MSSRs based on the 1/1,000 dose or 10 ppm are below the VRL or too close to it to be justified as a safe method of analysis.
However, if only the HBEL is used to calculate the MSSRs, many of these compounds could easily be considered for evaluation by visual inspection.
Figure 8 shows the same graph with the ▴ symbols for the MSSRs for the 1/1,000th of a dose/10 ppm combination removed. A rectangle is now drawn to contain the compounds that are above this visual residue limit and would allow for visual inspection. It should be obvious from this graph that, with the HBEL, many compounds, in particular low risk compounds, could possibly be considered for visual inspection.
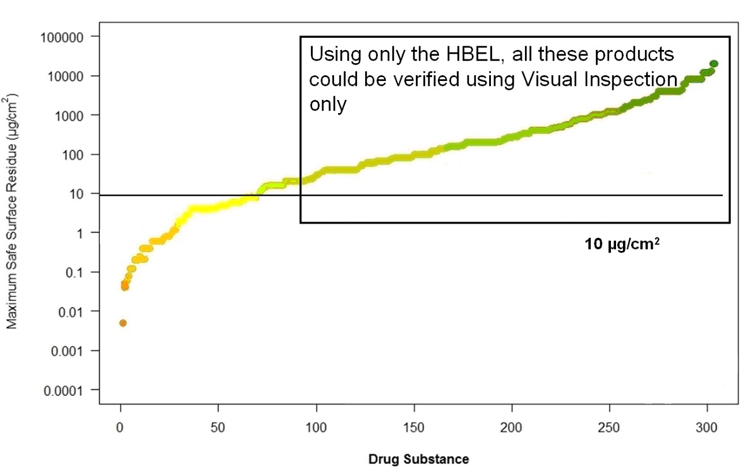
Figure 11: Drug products where HBEL can meet visual residue limits (10 µg/cm2)
graph courtesy of Ovais Mohammad
With a visual residue limit as high as 10 μg/cm2, about three-quarters of all compounds using the HBEL are acceptable for TOC analysis. The VRLs reported for many compounds are down to 1 to 2 μg/cm2, which would cover almost 90% of compounds in Figure 9.
Summary
This article provides a science-based, data-based, and risk-based framework for selecting analytical methods using ASTM International standards with the tools (scales, calculators) developed from them. Readers should now understand that:
- The level of risk in cleaning can be determined and used for selecting analytical methods.
- Identifying the level of risk can justify the use of simpler methods, including visual inspection alone.
- The replacement of the 1/1,000th dose and 10 ppm criteria with the HBEL allows for the use of simpler methods such as TOC and visual inspection for many compounds.
- Practical, achievable, verifiable, and safe limits are now possible using the HBEL.
- Several analytical methods may be combined into a suite of methods to provide a higher weight of evidence of successful cleaning performance.
- Risk-based method selection is dependent on method sensitivity and clinically relevant HBEL limits.
Peer Review
The authors wish to thank Sarra Boujelben, Gabriela Cruz, Ph.D., Mallory DeGennaro, Christophe Gamblin, Ioanna-Maria Gerostathes, Ioana Gheorghiev, MD, Ajay Kumar Raghuwanshi, and Basundhara Sthapit, Ph.D., for reviewing this article and for providing insightful comments and helpful suggestions.
References
- American Society for Testing and Materials (ASTM International) E3106 "Standard Guide for Science-Based and Risk-Based Cleaning Process Development and Validation," https://store.astm.org/e3106-22.html
- Andrew Walsh; Thomas Altmann; Joshua Anthes; Ralph Basile; Alfredo Canhoto, Ph.D.; Stéphane Cousin; Delane Dale; Parth Desai; Boopathy Dhanapal, Ph.D.; Jayen Diyora; Christophe Gamblin; Igor Gorsky; Jove Graham; Benjamin Grosjean; Reto Luginbuehl; Spiro Megremis; Ovais Mohammad; Mariann Neverovitch; Rod Parker; Jeffrey Rufner; Siegfried Schmitt, Ph.D.; Osamu Shirokizawa; and Stephen Spiegelberg, Ph.D., "A Data-Derived Approach For Selecting Criticality Levels In FMECAs For Cleaning Process Risk Analysis," Pharmaceutical Online, December 2019
- American Society for Testing and Materials (ASTM International) E3470 “Standard Guide for Using FMECA and HACCP for Performing Risk Identification, Risk Analysis & Risk Control on Cleaning Processes for Pharmaceuticals and Medical Devices,” https://store.astm.org/e3470-25.html
- American Society for Testing and Materials (ASTM International) E3219 “Standard Guide for Derivation of Health-Based Exposure Limits (HBELs)” https://store.astm.org/e3219-25.html
- FDA Guide to Inspections: Validation of Cleaning Processes, July 1993, U.S. Food and Drug Administration (FDA), https://www.fda.gov/inspections-compliance-enforcement-and-criminal-investigations/inspection-guides/validation-cleaning-processes-793
- Walsh, Andrew, Thomas Altmann, Alfredo Canhoto, Ester Lovsin Barle, David G. Dolan, Andreas Flueckiger, MD, Igor Gorsky, Robert Kowal, Mariann Neverovitch, Mohammad Ovais, Osamu Shirokizawa, and Kelly Waldron, "A Swab Limit-Derived Scale For Assessing The Detectability Of Total Organic Carbon Analysis," Pharmaceutical Online, January 2018
- Walsh, Andrew, Thomas Altmann, Alfredo Canhoto, Ester Lovsin Barle, David G. Dolan, Mariann Neverovitch, Mohammad Ovais, Osamu Shirokizawa, and Kelly Waldron, "An MSSR-derived Scale for Assessing the Detectability of Compound-Carryover in Shared Facilities," Pharmaceutical Online, December 2017
- Walsh, Andrew, Thomas Altmann, Ralph Basile, Stéphane Cousin, Delane Dale, Parth Desai, Boopathy Dhanapal, Jayen Diyora, Christophe Gamblin, Igor Gorsky, Jove Graham, Reto Luginbuehl, Spiro Megremis, Ovais Mohammad, Mariann Neverovitch, Laurence O'Leary, Rod Parker, Siegfried Schmitt Ph.D., Osamu Shirokizawa, Stephen Spiegelberg, Ph.D., and Norma Turner, “Revision Of The ASTM E3263 Standard For Visual Inspection Of Pharmaceutical Manufacturing Equipment And Medical Devices For Residues,” Pharmaceutical Online, January 2023
- American Society for Testing and Materials (ASTM International) E3418 “Standard Practice for Calculating Scientifically Justifiable Limits of Residues for Cleaning of Pharmaceutical and Medical Device Manufacturing Equipment and for Medical Devices,” https://store.astm.org/e3418-23e01.html
- Walsh, Andrew, Thomas Altmann, Ralph Basile, Alfredo Canhoto, Ph.D., Stéphane Cousin, Delane Dale, Parth Desai, Boopathy Dhanapal, Ph.D., Jayen Diyora, Christophe Gamblin, Igor Gorsky, Jove Graham, Benjamin Grosjean, Reto Luginbuehl, Spiro Megremis, Ovais Mohammad, Mariann Neverovitch, Rod Parker, Jeffrey Rufner, Siegfried Schmitt, Ph.D., Osamu Shirokizawa, Stephen Spiegelberg, Ph.D., and Randall Thoma, Ph.D., “Introduction to the New ASTM E3418 "Standard Practice For Calculating Scientifically Justifiable Limits Of Residues For Cleaning Of Pharmaceutical And Medical Device Manufacturing Equipment And For Medical Devices," Pharmaceutical Online, December 2023
- Online ASTM E3418 Safe Limit Calculator https://enrichedlifesciences.com/safelimit.aspx
- American Society for Testing and Materials (ASTM International) Work Item WK92599 “New Guide for Using Total Organic Carbon (TOC) Analysis in Cleaning Validation”
- American Society for Testing and Materials (ASTM International) E3263 “Standard Practice for Qualification of Visual Inspection of Pharmaceutical Manufacturing Equipment and Medical Devices for Residues,” https://store.astm.org/e3263-22e01.html
- Desai, P., and Walsh, A., “Validation of Visual Inspection as an Analytical Method for Cleaning Validation,” Pharmaceutical Online, August 2017
- European Medicines Agency, Questions and answers on implementation of risk-based prevention of cross-contamination in production and Guideline on setting health-based exposure limits for use in risk identification in the manufacture of different medicinal products in shared facilities, 19 April 2018, EMA/CHMP/CVMP/SWP/246844/2018
- Walsh, Andrew, Ralph Basile, Stéphane Cousin, Mariann Neverovitch, Mohammad Ovais and Osamu Shirokizawa, “Introduction To ASTM E3263-20: Standard Practice For Qualification Of Visual Inspection Of Pharmaceutical Manufacturing Equipment And Medical Devices For Residues,” Pharmaceutical Online, January 2021
- Harder, Sam “The Validation of Cleaning Procedures,” Pharmaceutical Technology, May 1984
- FDA Guide to Inspections: Validation of Cleaning Processes, July 1993, U.S. Food and Drug Administration (FDA), www.fda.gov
- Fourman, Gary and Michael Mullin, Ph.D., “Determining Cleaning Validation Acceptance Limits for Pharmaceutical Manufacturing Operations” in “Pharmaceutical Technology,” April 1993
- Walsh, Andrew “Cleaning Validation for the 21st Century: Acceptance Limits for Active Pharmaceutical Ingredients (APIs): Part I” Pharmaceutical Engineering, July/August2011, Volume 31, Number 4, pp. 74-83, www.ispe.org
- Parenteral Drug Association Technical Report No. 29, "Points to Consider for Cleaning Validation," 1998
- ISPE, Baseline Pharmaceutical Engineering Guide: Risk-Based Manufacture of Pharmaceutical Products: A Guide to Managing Risks Associated with Cross-Contamination. (ISPE, Tampa, FL, ed. First, 2010), vol. 7, pp. 186.
- Walsh, Andrew, Michel Crevoisier, Ester Lovsin Barle, Andreas Flueckiger, MD, David G. Dolan, Ph.D., Mohammad Ovais (2016) "Cleaning Limits—Why the 10-ppm and 0.001-Dose Criteria Should be Abandoned, Part II," Pharmaceutical Technology 40 (8)
- Richard J. Forsyth, Vincent Van Nostrand, and Gregory P. Martin "Visible-Residue Limit for Cleaning Validation and its Potential Application in Pharmaceutical Research Facility," Pharmaceutical Technology, Oct. 2, 2004