
Risk-Based Approaches To Establishing Sample Sizes For Process Validation
By Mark Durivage, Quality Systems Compliance LLC
Using confidence, reliability, and acceptance quality limits (AQLs) to determine sample sizes for process validation are proven methods to ensure validation activities will yield valid results based upon an organization’s risk acceptance determination threshold, industry practice, guidance documents, and regulatory requirements. Figure 1 shows the relationship between risk and sample size — as level of risk increases, the sample size increases accordingly.
Working with companies in FDA-regulated industries, I frequently see validations with inadequate sample sizes or otherwise without satisfactory statistical justification. This is due, in part, to engineers being thrown into the quality function without proper training or being told that “this is the way we have always done it”. This article is intended to provide background and guidance for people writing, executing, and summarizing validation protocols and reports.
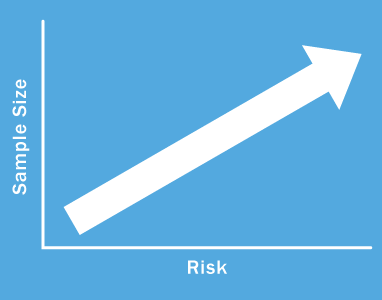
Figure 1: Relationship between risk and sample size
Rooted in the Regulations and Standards
The importance of validating using accepted statistical techniques with rationale for sample sizes is readily apparent in FDA and ISO requirements.
The definition of process validation, according to 21 CFR 820, the FDA’s Quality System Regulation (QSR) for medical devices, is “establishing by objective evidence that a process consistently produces a result or product meeting its predetermined specifications.” The QSR requires that:
Where the results of a process cannot be fully verified by subsequent inspection and test, the process shall be validated with a high degree of assurance and approved according to established procedures.
The QSR also requires that:
Where appropriate, each manufacturer shall establish and maintain procedures for identifying valid statistical techniques required for establishing, controlling, and verifying the acceptability of process capability and product characteristics. Sampling plans, when used, shall be written and based on a valid statistical rationale.
In the pharmaceutical world, 21 CFR 211, FDA’s Good Manufacturing Practices (GMP), requires that “appropriate written procedures, designed to prevent microbiological contamination of drug products purporting to be sterile, shall be established and followed. Such procedures shall include validation of all aseptic and sterilization processes.” As you may have noticed, 21 CFR 211 is “silent” in regard to sample size justification for process validation, but it uses wording such as “application of suitable statistical procedures where appropriate” in reference to product release and stability programs. However, experience has shown there is an expectation of using valid statistical and rationale for all aspects of pharmaceutical process validation.
ISO 13485:2016, the standard for medical device quality system requirements, has similar language requiring the organization to “validate any processes for production and service provision where the resulting output cannot be or is not verified by subsequent monitoring or measurement and, as a consequence, deficiencies become apparent only after the product is in use or the service has been delivered.” — using, “as appropriate, statistical techniques with rationale for sample sizes.”
The ISO 9001:2015 quality management system requirements stipulate that an organization “implement production and service provision under controlled conditions.” Controlled conditions shall include, as applicable, “the validation, and periodic revalidation, of the ability to achieve planned results of the processes for production and service provision, where the resulting output cannot be verified by subsequent monitoring or measurement.”
Statistical Methods for Determining Sample Size
Deciding which statistical techniques to use is dependent on the type of data for which validation is required. There are two types of data: variable and attribute. Variable data is those aspects measured using a continuous scale, such as weight, length, strength, etc. Attribute data has two different outcomes — for example, good/bad or pass/fail — or discrete counts. Due to the specific nature of variable data, it yields much more information than attribute data.
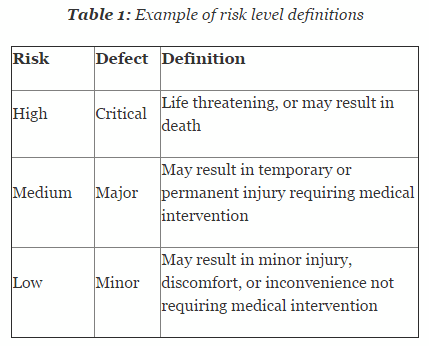
Risk is defined as combination of the probability of occurrence of harm and the severity of that harm. It is essential that risk levels be defined and applied uniformly throughout the organization. Table 1 shows an example of risk level definitions with accompanying defect classifications. These definitions can and will vary based upon the product(s) produced and their intended and unintended uses.
So how exactly is confidence and reliability related to attribute data? Confidence is defined as the amount of uncertainty about this estimate of probability, whereas reliability is the probability that a product will be functional at specified conditions for a specified amount of time. Confidence can be increased by increasing the sample size. In other words, the larger the sample, the more is actually known regarding the confidence of the reliability of the process.
Confidence and reliability have slightly different, yet similar, meanings when referring to variable data. In this context, confidence is the degree of certainty that the interval contains a certain percentage of each individual measurement in the population. Reliability is the fraction of the population the interval contains. The use of confidence and reliability for variable data assumes normality of the data. Other methods are also available that utilize non-parametric for data that is not normally distributed.
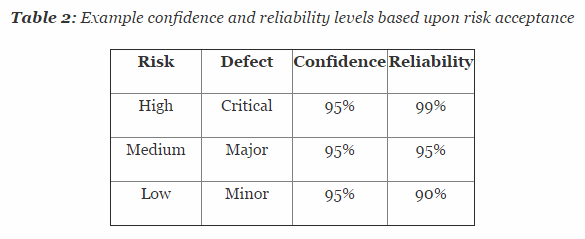
Table 2 depicts example confidence and reliability levels based upon risk. Of course, different confidence and reliability levels can and should be utilized based upon an organization’s risk acceptance determination threshold, industry practice, guidance documents, and regulatory requirements.
There is also a third method for determining statistically valid techniques and rationale for sample sizes. This method uses sampling tables with an appropriate AQL. According to ANSI/ASQ Z1.4-2008, the AQL is “the maximum defective percent … that, for purpose of sampling inspection, can be considered satisfactory as a process average.” This method relies on assigning AQLs based upon risk acceptance.
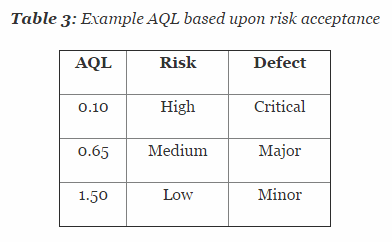
Table 3 depicts example AQL levels based upon risk. Different AQL levels can and should be utilized based upon the organizations risk acceptance determination threshold, industry practice, guidance documents, and regulatory requirements. A note of caution when using this method: Lot sizes used for validation activities should be consistent with the lot sizes anticipated for production.
Regardless of the method used to determine the statistically valid sample size and appropriate rational (confidence, reliability, or AQL), the method should be based on predefined definitions of risk associated with the product, costs associated with producing the product, and costs associated with inspection, measuring, and testing and consistently applied.
Subsequent articles in this series will provide how-to advice on applying these techniques in your organization.
About the Author
Mark Allen Durivage is the managing principal consultant at Quality Systems Compliance LLC and an author of several quality-related books. He earned a B.A.S. in computer aided machining from Siena Heights University and an M.S. in quality management from Eastern Michigan University. Durivage is an ASQ Fellow and holds several ASQ certifications including; CQM/OE, CRE, CQE, CQA, CHA, CBA, CPGP, and CSSBB. He also is a Certified Tissue Bank Specialist (CTBS) and holds a Global Regulatory Affairs Certification (RAC). Durivage resides in Lambertville, Michigan. Please feel free to email him at mark.durivage@qscompliance.com with any questions or comments, or connect with him on LinkedIn.
References:
- Durivage, M.A., 2014, Practical Engineering, Process, and Reliability Statistics, Milwaukee, ASQ Quality Press
- Durivage, M.A. and Mehta B., 2016, Practical Process Validation, Milwaukee, ASQ Quality Press
- Durivage, M.A., 2016, The Certified Pharmaceutical GMP Professional Handbook, 2nd Ed., Milwaukee, ASQ Quality Press.
- ISO 9001:2015 Quality management systems—Requirements
- ISO 13485:2016 Medical devices—Quality management systems—Requirements for regulatory purposes
- United States Code of Federal Regulations 21 CFR:
- Part 211 Current good manufacturing practice for finished pharmaceuticals
- Part 820 Quality system regulation
- ANSI/ASQ Z1.4-2008: Sampling Procedures and Tables for Inspection by Attributes